The Activity tab is a running log of what went out to remediation teams, what failed to go out, and what scans found afterward. It is built automatically from scan results and ticket updates — nobody has to enter anything.
Open the activity log
Select Exposure in the top navigation bar, then select the Activity tab.
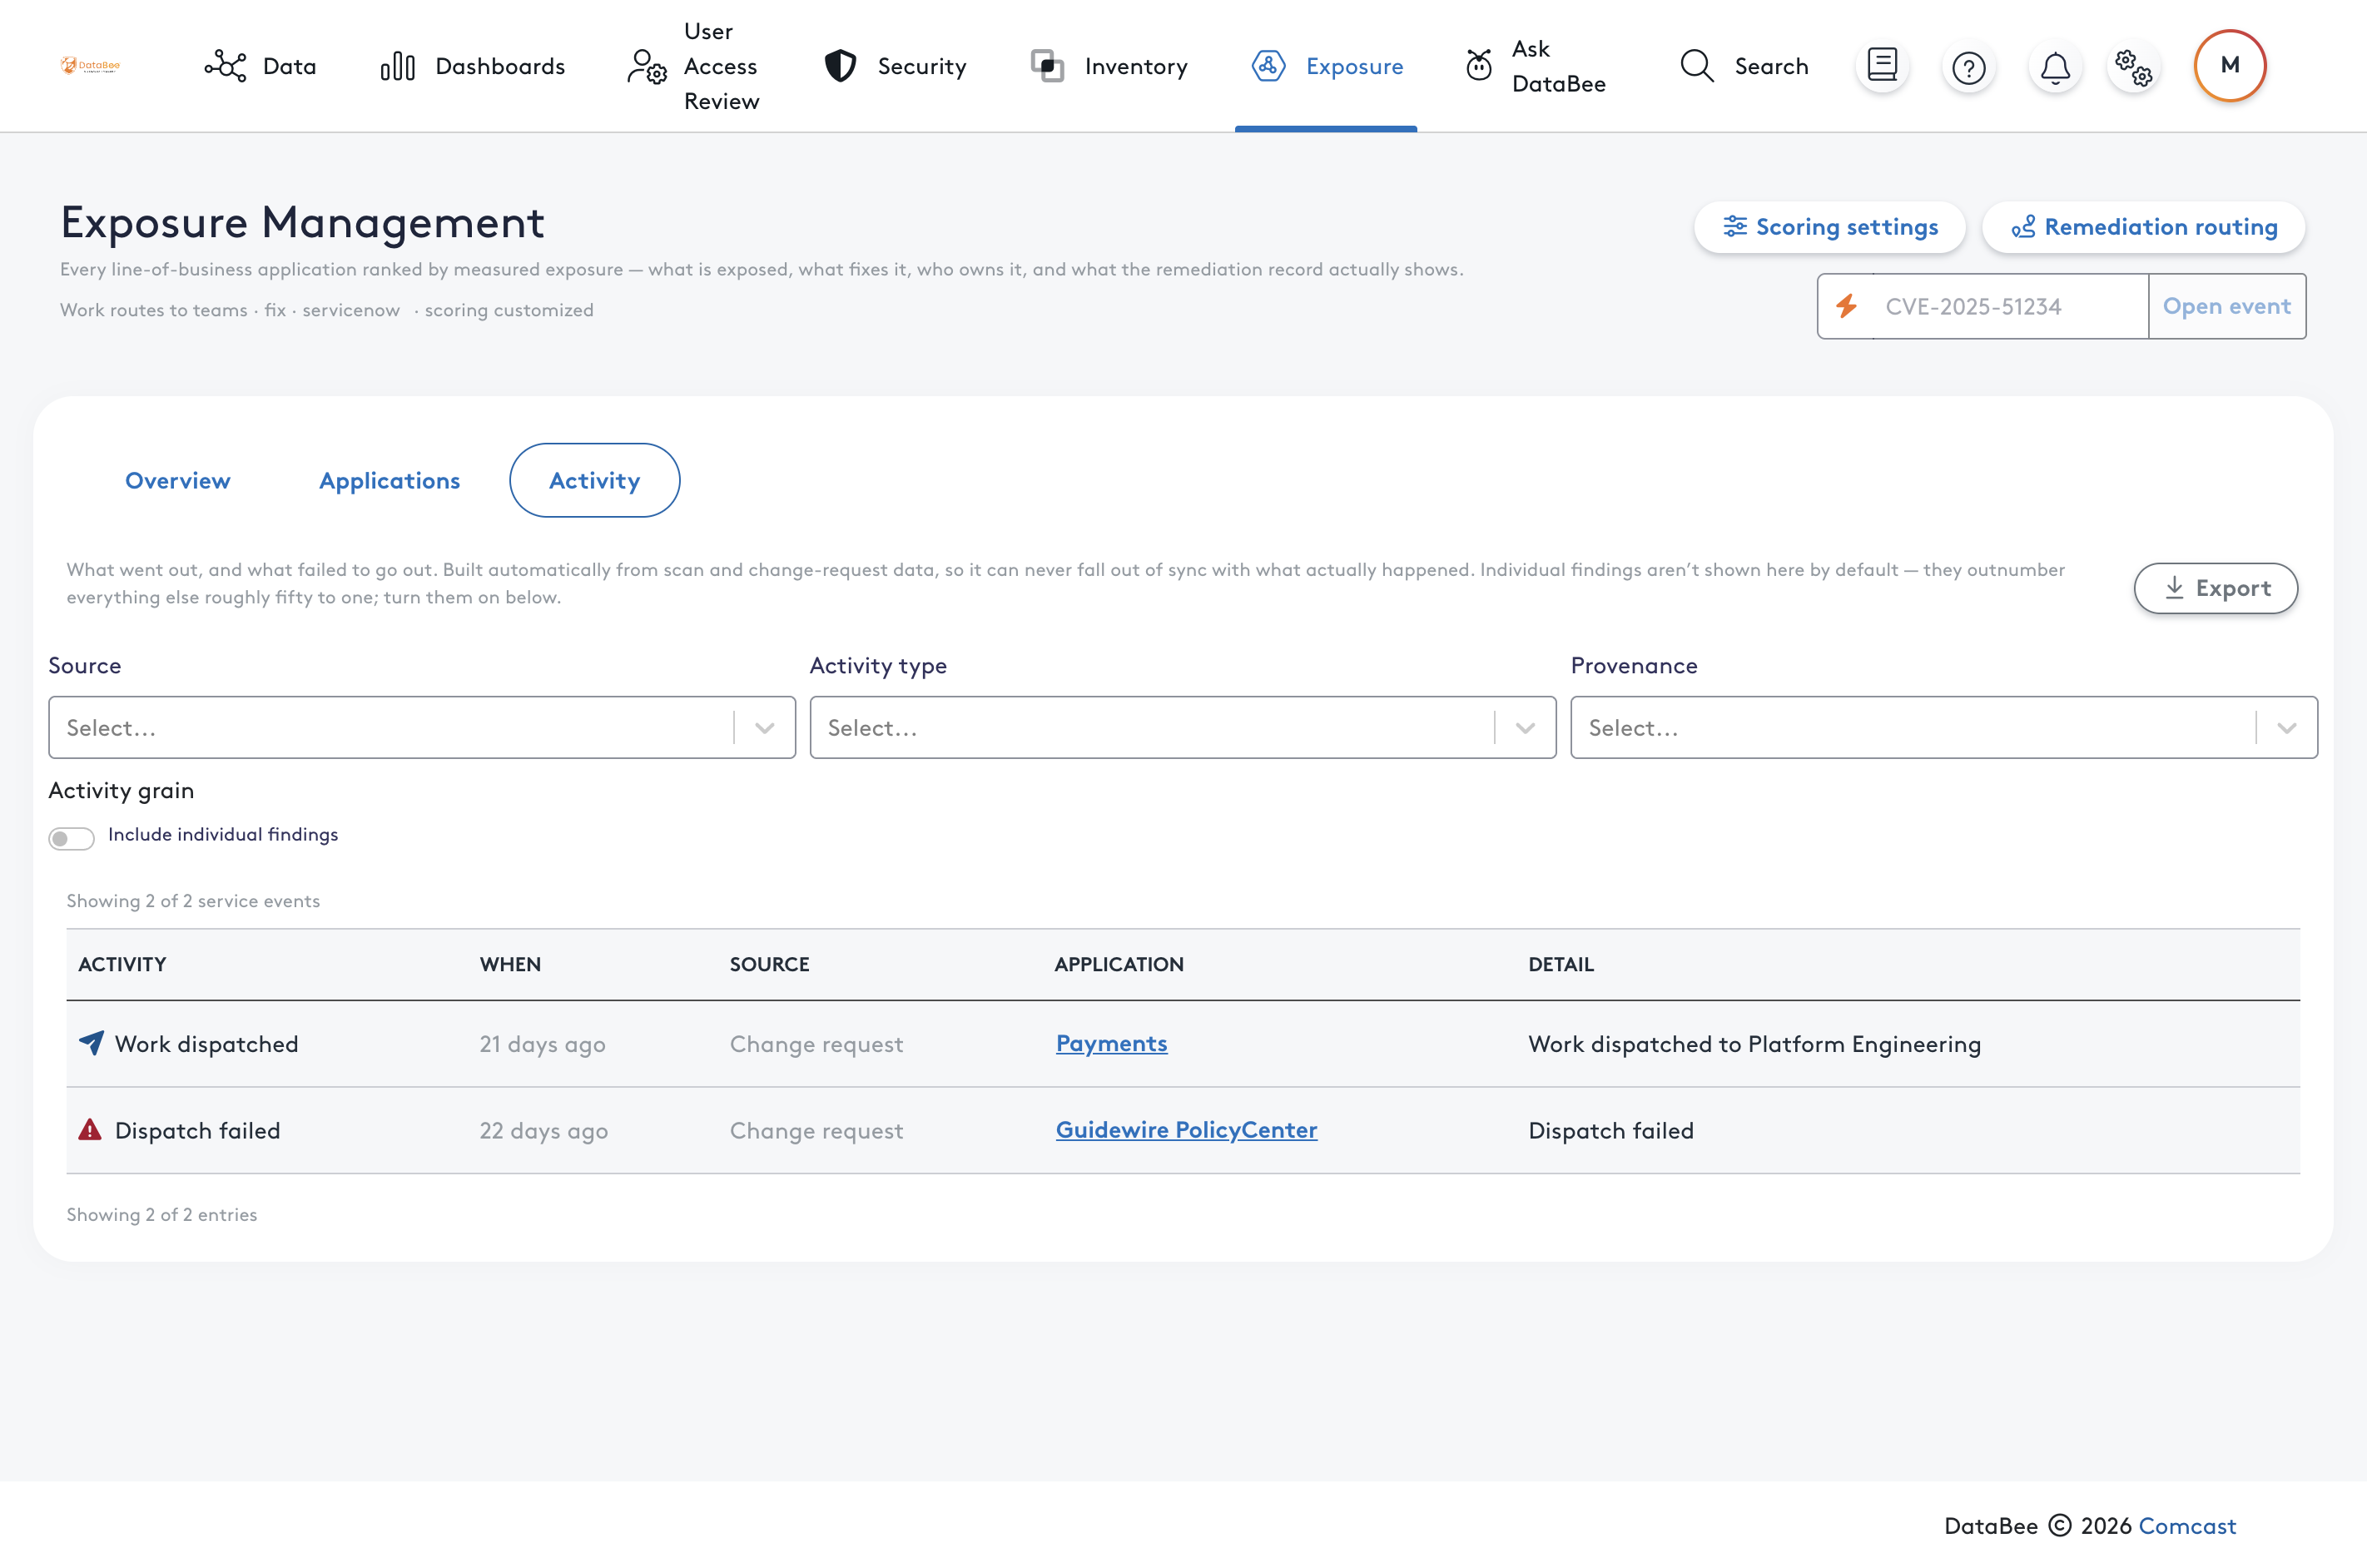
The Activity tab lists recent dispatches and scan evidence, newest first.
What you will see
Each entry shows what happened, when, where the information came from, which application it concerns, and the details. Common entries include:
- Work dispatched — work was sent to a team, with the ticket number and how many findings it covers.
- Dispatch failed — no ticket was created, so that work has not been sent. Send it again from the application.
- Dispatch stalled — a ticket has not moved for several days.
- Cleared — a later scan no longer finds a vulnerability.
- Regressed — a vulnerability that had been cleared has come back. These entries are marked Needs mapping until the scanner data they depend on is fully mapped.
Select an application name to open its details.
Filtering activity
By default the log shows dispatches and summary scan evidence, so it stays readable. Use the filters to change what is shown:
- Source — Scan or Change request.
- Activity type — the kind of entry, such as Work dispatched or Cleared.
- Provenance — Live entries, or Needs mapping entries that depend on scanner data that is not fully mapped yet.
- Include individual findings — show an entry for every individual finding, not just summaries.
The log shows 50 entries at a time; select Show N more to load the next set.
Exporting activity
Select Export on the Activity tab to download the entries currently loaded in the log as a CSV file — useful as evidence for audits or status reports. If you want more entries in the file, load them first with Show N more.