The material in this section describes using the ATD GUI and command-line interface (CLI) to configure the system settings for a BluVector Sensor. System Administrators have all configuration privileges. Lead Analysts have limited configuration privileges.
Users with System Administrator access can perform the following actions:
Change user account settings and interface preferences
Restore the factory setting of the system configuration
Configure the system, including:
Creating an ATD GUI welcome banner
Adding a BluVector Portal API key
Generating certificate signing requests and viewing SSL certificates
Configuring Security Assertion Markup Language (SAML) / Single-Sign On (SSO)
Managing Smart Cards for logging in
Configure collection engines and manage the systems that process raw network traffic
Configure analysis engines and manage the analysis engines that are embedded within the BluVector Sensor
Configure intelligence feeds and threat intelligence providers
Configure system outputs and add DataBee event forwarding, TCP/UDP, syslog, email or file outputs
Configure post analyzers as secondary analysis engines
Configure workflows, including event rules, collections and scoring
Contact Customer Support and generate a support bundle when encountering unexpected behavior
Access the BluVector ATD Host and perform functions such as:
Running an Exec Bundle supplied by BluVector Customer Support
Setting system IP and hostname
Rebooting and shutting down the system
Performing software updates
Managing users, including remote users via LDAP
Adding a network proxy
Adding an NTP server
Viewing License and Certificate Signing Requests (CSRs)
Joining and unjoining BluVector Sensors to a BluVector Grid (only available on an ATD Central Manager)
Users with Lead Analyst access can perform these actions:
Configure collection engines and manage the systems that process raw network traffic
Configure analysis engines and manage the analysis engines that are embedded within the BluVector Sensor
Configure learning, including managing classifiers
Configure workflows, including event rules, collections and scoring
View administrative notifications
Logging into the ATD GUI
To configure the system, first log into the ATD GUI.
Procedure: Log into the ATD GUI
Follow these steps to log into the ATD GUI and display the default dashboard.
In a browser, go to the BluVector Sensor network address over the HTTPS protocol. The “ATD GUI Login” Screen appears (see Figure: ATD GUI Login Screen with Username and Password). If your system has Smart Cards enabled, the “Login Screen” will appear with a prompt to insert a card into the reader, rather than asking for a username and password (see Figure: ATD GUI Login Screen with Smart Cards Enabled). See Section: Managing Smart Cards for more information about Smart Cards.
 Fig. 48: ATD GUI Login Screen with Username and Password
 Fig. 49: ATD GUI Login Screen with Smart Cards Enabled
Log into the sensor using an account that has administrative privileges (or use the following default credentials):
Username: bvadmin
Password: [configured by administrator]
Select Login. Your default dashboard appears. (see Figure: Default Dashboard View)
 Fig. 50: Default Dashboard View
Selecting the user name at the top right allows you to change account settings and to configure connectors. See Section: Configuring User Account, Time Zone, and Theme Settings and Section: Configuring Connectors for more details.
The sprocket icon at the top right brings you to the “Main Configuration” Screen, which allows you to configure many more parts of the system. See the sections starting at Section: Making Changes from the Main Configuration Screen for more details.
The menu on the left side provides access to different views and functions. One of the menu choices allows you to configure the platform (see Section: Configuring the BluVector ATD Host).
Configuring User Account, Time Zone, and Theme Settings
You can customize the account name, email address, local time zone setting, visual theme, and other account settings through the ATD GUI. This section describes how to change these settings.
Procedure: Change Account Name and Email Address
Follow these steps to change the user name and email address. This information will automatically appear in Submit to BV requests.
From the ATD GUI, select your user name in the upper right corner. A menu appears.
Select Account.
Select My Account. The “Account Configuration” Screen appears (see Figure: Account Configuration Screen).
 Fig. 51: Account Configuration Screen
The account role of the logged-in user is displayed, along with details about the account.
Enter the following information:
First name
Last name
E-mail address
Select Update.
Procedure: Enable or Disable Use of the Local Time Zone
Follow these steps to change the time zone setting.
From the ATD GUI, select your user name in the upper right corner. A menu appears.
Select Account.
Select My Account. The “Account Configuration” Screen appears (see Figure: Account Configuration Screen).
Select or clear Show Local Time. When local time is in use:
Timestamps will be based on the browser’s time zone setting.
Datetime entries for queries will be interpreted in the local time zone, unless explicitly stated otherwise.
Select Update.
Procedure: Change Visual Theme
Follow these steps to change the visual theme of the ATD GUI.
From the ATD GUI, select your user name in the upper right corner. A menu appears.
Select Account.
Select My Account. The “Account Configuration” Screen appears (see Figure: Account Configuration Screen).
Select the current entry for Theme Color. A menu appears.
Select either Light or Dark. Instructions in this document are based on the Light setting. If you choose a Dark theme, colors for screen elements (such as arrows) may appear different from the instructions.
Select Update.
Making Changes from the Main Configuration Screen
The “Main Configuration” Screen allows you to configure many parts of the system, such as machine learning, BluVector Collectors, analyzers, threat intelligence providers, outputs, post analyzers, workflows, endpoints, and the BluVector Portal. It also supports sending technical information to Customer Support.
To reach the “Main Configuration” Screen:
Log in to the ATD GUI.
Select the sprocket icon at the top right.
Select any of the menu choices that appear, such as System. The “Main Configuration” Screen appears with settings for the menu item you selected (see Figure: Main Configuration Screen).
It is generally a two-step process to make changes from the “Main Configuration” Screen, as follows:
Make, save, and review the desired changes, called staging. Staged changes have no effect on system operations until they are applied. Figure: Screen with Staged Configuration Changes shows how a screen appears when there are staged changes.
When making configuration changes from an ATD Central Manager, you must also select the scope of the change prior to saving or staging the changes. You can choose from these scoping options:
Common: Changes will affect all BluVector Collectors and the ATD Central Manager.
Collector ID: Changes will affect only the selected BluVector Collector. When available, the hostname for a system is used as the Collector ID. If a system is not configured with a hostname, a unique alphanumeric identifier will be assigned.
Central Manager ID: Changes will affect only the ATD Central Manager.
Review your staged changes by selecting Review Staged Changes. A review screen appears (see Figure: Review Screen for Staged Changes).
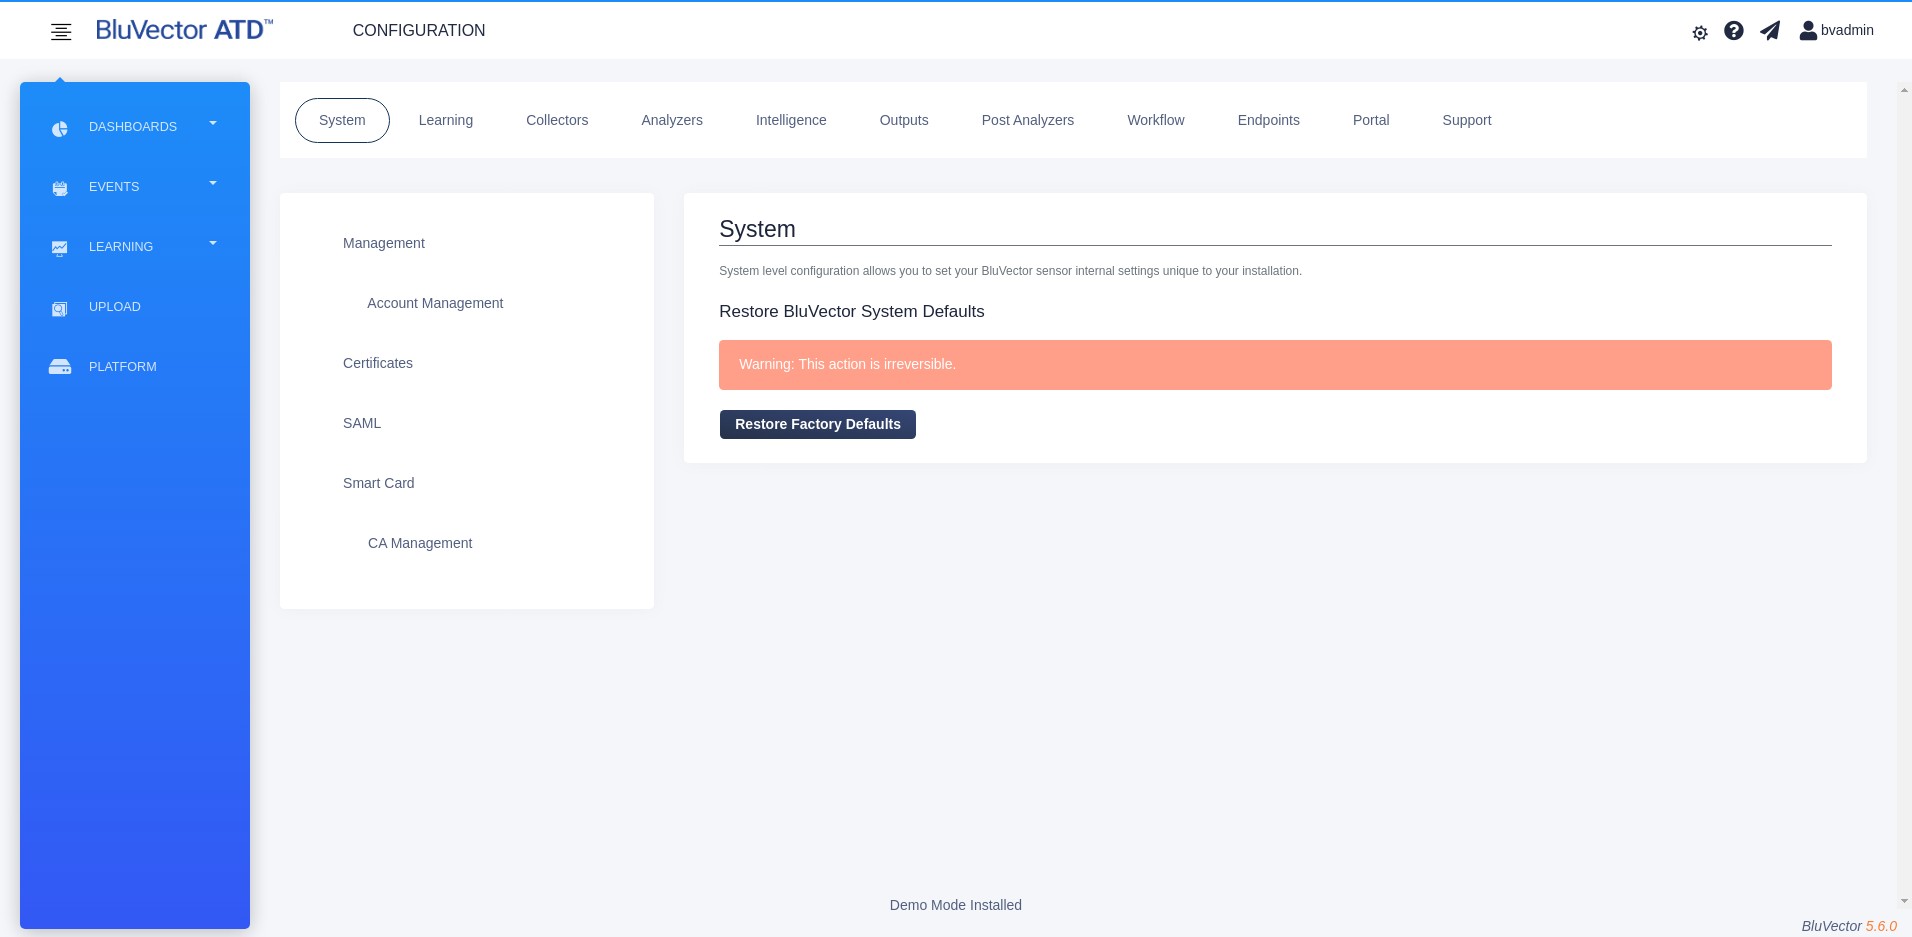
Fig. 52: Main Configuration Screen
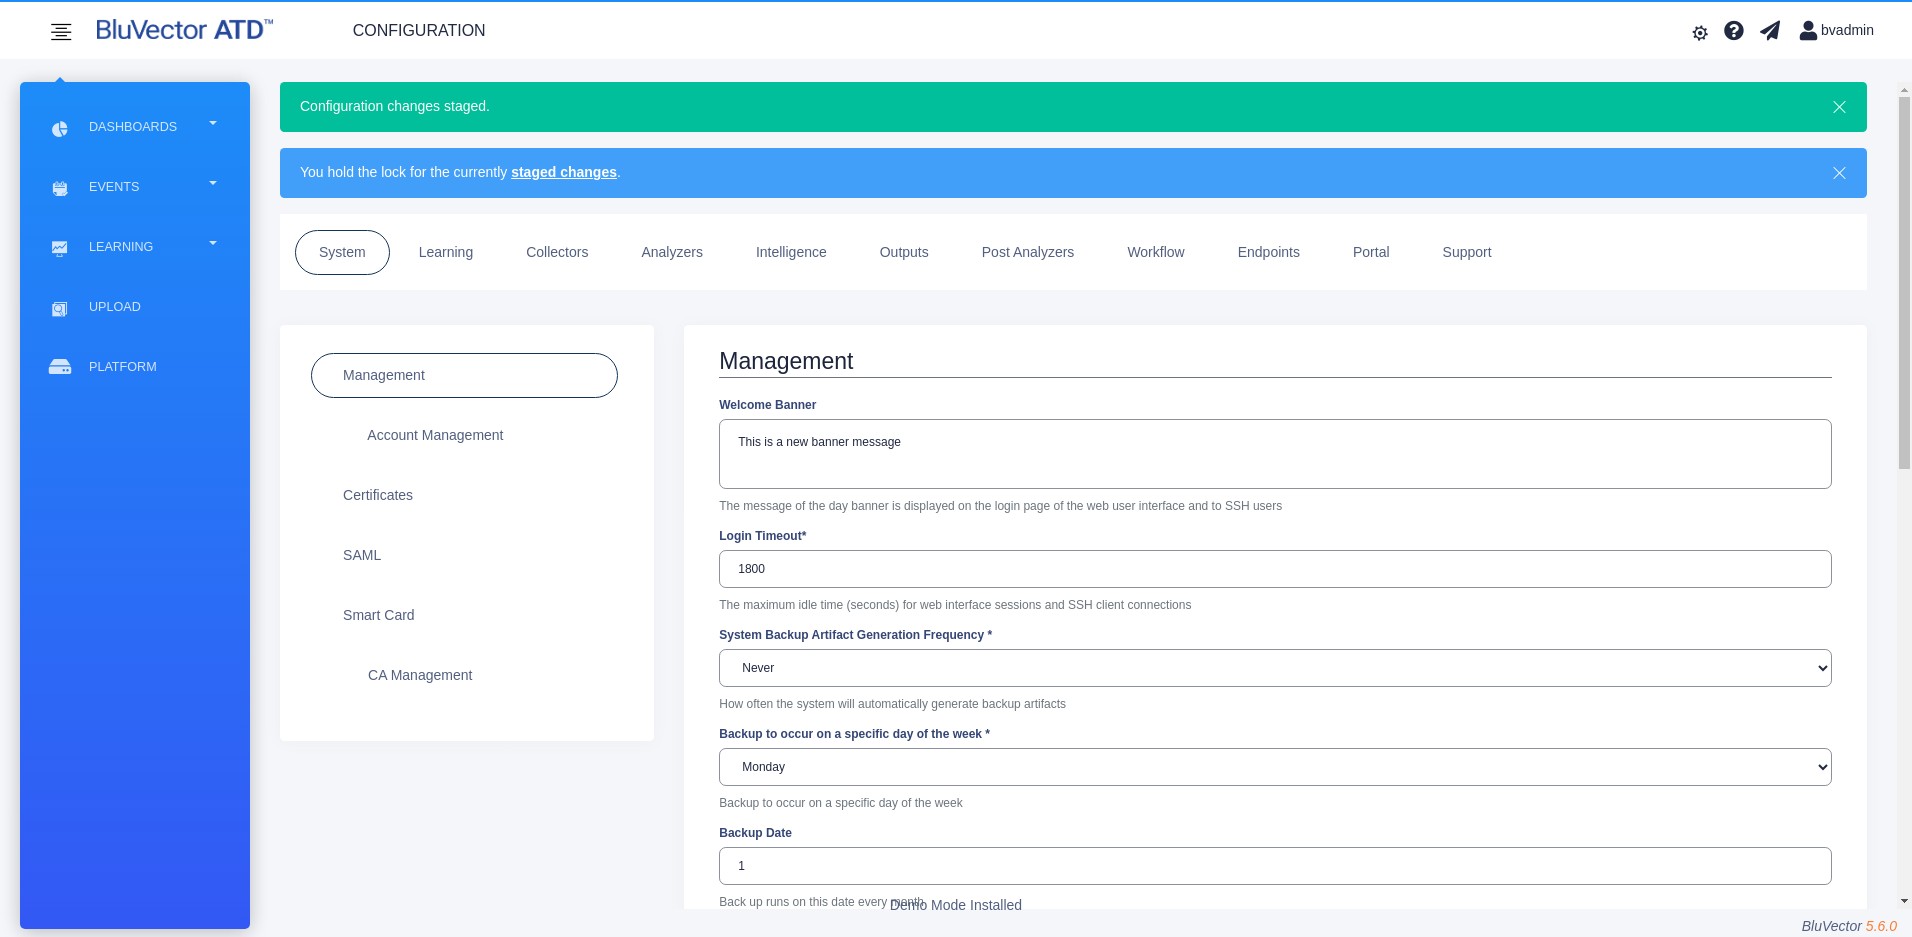
Fig. 53: Screen with Staged Configuration Changes
After reviewing, you may choose to either discard all staged changes by selecting Discard All Changes, or you can proceed to the next step to apply the changes.
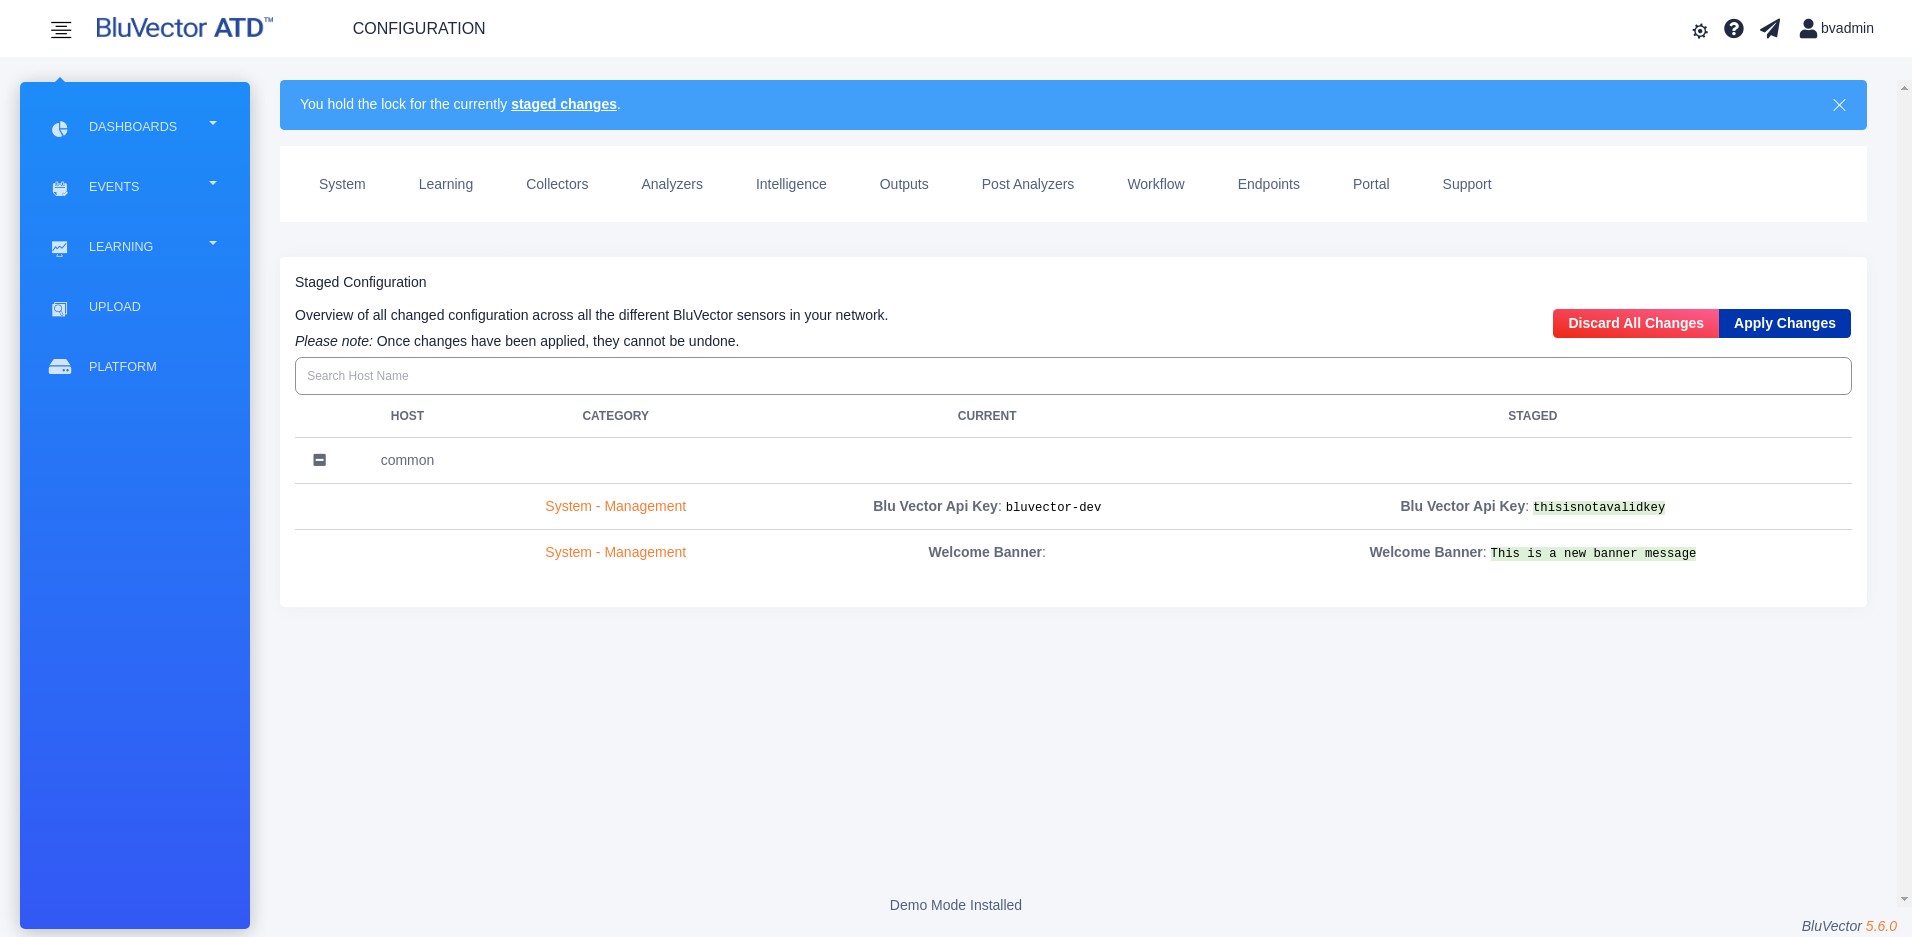
Fig. 54: Review Screen for Staged Changes
To carry through with the changes, select Apply Changes. It may take several minutes for the changes to go into effect.
See the following sections for more details on making configuration changes that are available from the “Main Configuration” Screen:
Section: Configuring General System Settings, including restoring the system to factory defaults, managing system settings, and viewing installed certificates
Section: Configuring Learning
Section: Managing the Artifact Storage
Section: Configuring Collection Engines
Section: Configuring Outputs
Section: Configuring Post Analyzers
Section: Configuring Workflows
Section: Configuring Endpoints
Section: Configuring BluVector Portal
Section: Generating Support Bundles
See these sections for additional configuration options:
Section: Configuring Connectors
Section: Configuring the BluVector ATD Host
Configuring General System Settings
You can customize general BluVector System settings and manage the state of the system. This section describes how to:
Restore the system configuration to factory settings.
Make minor adjustments for managing the system, such as customizing the system welcome banner, setting the timeout, adding additional DNS suffixes for accessing BluVector ATD, setting the backup artifact generation frequency, setting the BluVector API key, and customizing the group permission maps.
View and replace installed HTTPS certificates.
Configure the settings to use SAML/SSO for logging in.
Set up and configure the Smart Cards feature for logging in.
To continue, bring up the “System Configuration” Screen as follows:
First, navigate to the “Main Configuration” Screen (see Section: Making Changes from the Main Configuration Screen).
Select System. The “System Configuration” Screen appears (see Figure: System Configuration Screen).
 Fig. 55: System Configuration Screen
The following sections describe the settings you can change from the “System Configuration” Screen, such as:
Section: Managing the System Settings
Section: Viewing Installed Certificates
Section: Configuring SAML/SSO
Section: Managing Smart Cards
Restoring the System Factory Defaults
You can restore the BluVector System to the factory default settings from the “System Configuration” Screen. Restoring to the factory default settings will clear out all Threat Vectors configured on the system, except Unmatched Suspicious Events.
Procedure: Restore the Factory Default Configuration
Follow these steps to restore the system to factory defaults:
Navigate to the “System Configuration” Screen (see Section: Configuring General System Settings).
Select Restore Factory Defaults.
You will be prompted with a warning about the restoration.
Select OK to complete the request.
Select Cancel to cancel the request.
After the system has been restored to the default settings, you should see a green banner across the top of the screen that says: Configuration settings restored to defaults.
Managing the System Settings
This section describes how you can modify the following features of the system:
Welcome banner that is displayed above the initial login screen in the ATD GUI for all users. (To set the welcome banner for Cockpit, see Section: Setting a Timeout and Banner for Cockpit.)
Login timeout setting for the ATD GUI. (To set the timeout for Cockpit, see Section: Setting a Timeout and Banner for Cockpit.)
Set backup artifact generation frequency.
Additional DNS suffixes for accessing BluVector ATD by multiple names.
Mapping of the user groups established in BluVector ATD Host to privilege groups within the application.
These procedures are described below.
Procedure: Modify the Welcome Banner or Login Timeout
Follow these steps to set or modify the welcome banner or the timeout setting.
Navigate to the “System Configuration” Screen (see Section: Configuring General System Settings).
Select Management from the menu that appears on the left. The “System Management Configuration”
Screen appears (see Figure: System Management Configuration Screen.)
 Fig. 56: System Management Configuration Screen
To modify the welcome banner, enter your desired welcome message in the ‘Welcome Banner’ field.
To modify the login timeout, enter the desired time in seconds in the ‘Login Timeout’ field.
Select Stage Changes.
Your enterprise may have various internal or external DNS values that require login access to BluVector ATD. You can add DNS suffix values that will be accepted by the system.
Procedure: Adding Additional DNS Suffixes for Login Access
Navigate to the “System Configuration” Screen (see Section: Configuring General System Settings).
Select Management from the menu that appears on the left. The “System Management Configuration” Screen appears (see Figure: System Management Configuration Screen.)
In the ‘Alternate DNS Suffixes’ field, enter an additional DNS suffix value to be used for logging in. It must begin with a period.
BluVector ATD will then take the hostname of the machine and add it to the beginning of the value provided in this field. For example: If the original system is named
adt-sensor.foo.bar.baz.com, the hostname would beatd-sensor. That hostname would be combined with the value you enter into this field. You would then be able to access BluVector ATD atatd-sensor.some.thing.
To add additional DNS suffixes, select Add to create a new entry row.
To delete a DNS suffix entry, select the trash can icon next to the row you wish to remove.
BluVector offers several features through the BluVector Portal. All customers have access to the BluVector Portal. To enable use of any of the BluVector Portal features:
You must configure an API key.
Network connectivity to
https://api.bluvector.iomust be available.
Procedure: Setting System Backup Artifact Generation Frequency
Follow these steps to configure how often the system will automatically generate backup artifact:
Navigate to the “System Configuration” Screen (see Section: Configuring General System Settings).
Select Management from the menu that appears on the left. The “System Management Configuration” Screen appears (see Figure: System Management Configuration Screen.)
Select one of the available generation frequencies from the ‘System Backup Artifact Generation Frequency’ dropdown. Only the most recent artifact will be maintained on the system. If you wish to preserve multiple artifacts, you must copy them off the system.
Select Stage Changes.
Procedure: Add a BluVector Portal API Key
Follow these steps to configure a BluVector Portal API key:
Navigate to the “System Configuration” Screen (see Section: Configuring General System Settings).
Select Management from the menu that appears on the left. The “System Management Configuration” Screen appears (see Figure: System Management Configuration Screen.)
Enter the BluVector API key provided by your BluVector Customer Support Engineer into the ‘BluVector API Key’ field.
Select Stage Changes.
When configuring remote users, it is often necessary to add additional user groups to the system. Remote user groups must include the domain, for example: admin@domain.com. There are three roles groups, whether remote or local, that user groups can be added to: Administrator, Lead Analyst, and Regular. All members of groups in the Administrator set will have administrator rights, while those in the Regular set will have basic user rights. Lead Analyst members have basic user rights plus this limited set of administrator rights:
Configure collection engines
Configure analyzers
Configure learning
Configure workflows
View administrative notifications
Procedure: Adding a User Group
Navigate to the “System Configuration” Screen (see Section: Configuring General System Settings).
Select Management from the menu that appears on the left. The “System Management Configuration” Screen appears (see Figure: System Management Configuration Screen).
Determine if the user group should be considered Administrator, Lead Analyst, or Regular.
Select Add under the selected group type.
Enter the group name (you must include the domain for remotely managed groups).
Select Stage Changes.
Deactivating User Accounts
System administrators can forcibly deactivate user accounts preventing that user from being able to log into the ATD GUI and invalidating existing REST API tokens associated with that user. Deactivating the account does not prevent a local user from logging into BluVector ATD via the command-line or SSH or remove the account completely from the system. It is recommended to manually deactivate domain accounts that have been removed from membership in authorized groups.
Procedure: Deactivating and Reactivating Local User Accounts
Follow these steps to set or modify the welcome banner or the timeout setting.
Navigate to the “System Configuration” Screen (see Section: Configuring General System Settings).
Select Account Management from the menu that appears on the left. The “System Account Management
Configuration” Screen appears (see Figure: System Account Management Configuration Screen.)
 Fig. 57: System Account Management Configuration Screen
Locate the account you wish to deactivate and click the Deactivate Account button.
A deactivated account may be reactivated by pressing the Activate Account button.
Viewing Installed Certificates
You can view the SSL certificate that is installed. You can also replace it. These procedures are described below. This SSL certificate is used by the ATD GUI, but not by Cockpit. To set an SSL certificate for Cockpit, see Section: Using a Signed Certificate for Cockpit.
Procedure: View and Replace an Installed Certificate
Follow these steps to view or replace an SSL certificate:
Navigate to the “System Configuration” Screen (see Section: Configuring General System Settings).
Select Certificates from the menu that appears on the left. The “Certificates” Screen appears (see Figure: Certificates Screen with Installed Certificate).
 Fig. 58: Certificates Screen with Installed Certificate
View the parameters of the installed SSL certificate, such as valid date range, subject, and issuer.
To replace the existing certificate with a different one, select Replace Certificate. The “Certificate Signing Request” Screen appears. (see Figure: Certificate Signing Request Screen to Generate a CSR or Self-signed
Certificate).
 Fig. 59: Certificate Signing Request Screen to Generate a CSR or Self-signed Certificate
Fill out the fields on the screen.
Select Generate Certificate Signing Request. This will either generate a CSR or generate and install a new self-signed certificate.
Configuring SAML/SSO
BluVector ATD supports Single-Sign On (SSO) logins using Security Assertion Markup Language (SAML). SAML Version 2 is supported.
SAML logins can only be used in the ATD GUI, not on the platform layer (BAH).
When SAML login is enabled, users can continue to use local system accounts to log in.
When SAML login is enabled, users will see a new button to initiate a SAML login operation from the main login page.
The SAML login feature will not function if Smart Card logins are also enabled.
To configure the SAML settings, you will first need to:
Add your user groups on the “System Management Configuration” Screen to define external groups allowed for login. See Section: Managing the System Settings for more information.
Obtain an XML Metadata document file for your SAML IDP from your SSO administrator.
Procedure: Configure SAML Settings
Follow these steps to configure the settings for implementing SAML:
Navigate to the “System Configuration” Screen (see Section: Configuring General System Settings).
Select SAML from the menu that appears on the left. The “SAML” Screen appears (see Figure: SAML Screen).
 Fig. 60: SAML Screen
Select Choose File to select your XML Metadata document. It must be an XML document.
Select Upload to upload the chosen XML Metadata document file.
To enable the service, select SAML Authentication Enabled. When enabled, BluVector ATD will publish the metadata to allow SSO at
/api/saml2/metadata/.Enter a URL to indicate the attribute name to identify a user’s username in the ‘SAML Username Attribute Name’ field.
Enter a URL to indicate the attribute name to identify a user’s group membership in the ‘SAML User’s Given Name’ field.
Optionally, you may enter URLs to map to the user’s first and last name in the ‘SAML User’s Given Name’ and ‘SAML User’s Surname’ fields.
If desired, you may also enter a URL to map to the user’s email address in the ‘SAML User’s Email’ field.
Select Stage Changes to apply and save the updated configuration.
Managing Smart Cards
BluVector ATD offers the ability to log in using Smart Cards instead of entering a username and password. This adds convenience plus an extra security layer by requiring the user to have the physical card as well as enter a PIN to log in.
Smart Cards have a chip in them, which stores an encrypted user certificate with an expiration date. The user certificates are issued by a certificate authority (CA).
Once Smart Cards are configured and enabled in BluVector ATD, users will be prompted to insert a card into an attached card reader. Users will be required enter a PIN in order to access the certificates on the smart card. The system will then check the expiration date on the certificate and verify that the user certificate was actually signed by a trusted CA. The system also checks configured revocation lists to make sure the certificate has not been revoked. Then it searches for the user within the joined domain using their certificate and gathers their group memberships within the domain. Domain group membership is then mapped to BluVector ATD user roles using the configured values in the System Management section. If the login is successful, the default ATD GUI screen appears, typically the Overview Dashboard (see Section: Using the Overview Dashboard).
Before enabling Smart Cards, you must ensure that:
You have set up your remote user group mappings to the BluVector ATD user roles. See Section: Managing the System Settings for more information.
You have joined the domain. This is described in Section: Configuring Remote Users and Active Directory for remote users, and the procedure is the same.
After you enable Smart Cards, the Cockpit platform interface will become unavailable. You will still be able to use SSH for command-line interface (CLI) commands. See Section: Using the Command-line Interface (CLI) for more information about using the CLI. A Smart Card will be required to log into the ATD GUI before using SSH. The authorized SSH keys are periodically cleaned up. After cleanup, you must log in again to the ATD GUI in order to use SSH again.
Local accounts may be used for emergency system recovery in case there is a problem using the Smart Cards. Local accounts are allowed to access the system using username and password authentication over SSH.
The following procedures describe how to turn on the Smart Cards feature and configure its settings, how to turn it off, and how to customize the files used for verification.
Procedure: Enable and Configure the Smart Cards Feature
Follow these steps to start using the Smart Cards Feature:
Navigate to the “System Configuration” Screen (see Section: Configuring General System Settings).
Select Smart Card from the menu that appears on the left. The “Smart Cards Configuration” Screen appears (see Figure: Smart Cards Configuration Screen).
 Fig. 61: Smart Cards Configuration Screen
To enable the Smart Cards feature, select Require smartcard to login.
In the optional ‘OCSP Responder URL’ field, enter an Online Certificate Status Protocol (OCSP) URL that can be used to check the revocation status for Smart Cards. This allows BluVector ATD to submit the user certificate to a server for validation.
To include a nonce (a number used only once) in the OCSP requests, select Include Nonce in OCSP Requests. Some servers require a nonce to be used. If a nonce is supported but optional, we recommend enabling it as it provides an extra layer of security around the OCSP checks.
To use an online source for a Certificate Revocation List (CRL) to check the revocation status, enter the URL in the optional ‘CRL URL’ field. The system routinely updates the list from this URL.
To change the number of hours between updating the CRL, enter the hours in the ‘CRL Update Polling Frequency’ field.
Enter the number of hours to wait before emptying the contents of the SSH keys (
.ssh/authorized_keys) in the ‘SSH keys cleanup interval’ field. To disable cleanup, enter 0. Once the SSH keys are cleaned up, users must log into the ATD GUI with their Smart Card before using SSH again.Select Stage Changes. When the changes take effect, the next login will require a Smart Card.
Procedure: Disable the Smart Cards Feature
Follow these steps to turn off the Smart Cards Feature:
Navigate to the “System Configuration” Screen (see Section: Configuring General System Settings).
Select Smart Card from the menu that appears on the left. The “Smart Cards Configuration” Screen appears (see Figure: Smart Cards Configuration Screen).
To disable the Smart Cards feature, deselect Require smartcard to login.
Select Stage Changes and apply the changes.
Procedure: Upload the CA Trust Bundle for Smart Cards
The Smart Cards feature requires a CA trust bundle. The CA trust bundle contains trusted CA signing certificates for verifying the user certificates. A default CA trust bundle is provided. Department of Defense (DoD) root CA certificates are included in the default bundle.
You should upload your own CA trust bundle in order to include your CA keys in it. The CA trust bundle must be in .PEM format. You may also provide your own Certificate Revocation List (CRL) file. Only one CA trust bundle and one CRL file may be in use at a time. The uploaded files are maintained through the Artifact Storage. See Section: Managing the Artifact Storage for a description of Artifact Storage. Follow these steps to upload files for use with the Smart Cards Feature:
Navigate to the “System Configuration” Screen (see Section: Configuring General System Settings).
Select CA Management from the menu that appears on the left. The “Smart Cards Certificates Management” Screen appears (see Figure: Smart Cards Certificates Management Screen).
 Fig. 62: Smart Cards Certificates Management Screen
Select Upload File to select files from the local machine to upload.
Select the file to upload.
Select the locations that should have this file enabled.
Choose the filetype for the upload:
trust - Allows you to upload a CA trust bundle.
crl - Allows you to upload a Certificate Revocation List (CRL).
Select Upload.
Select Restart Smartcard for the changes to take effect.
After uploading, the screen displays the current list of uploaded files. See Section: Managing the Artifact Storage for more information about the displayed columns. An additional column SMARTCARD FILETYPE displays the filetype.
You can download a file by selecting the download icon for that row.
To remove a file, select the trash can icon on the row containing the file you wish to remove. You will be asked to confirm the deletion.
Configuring Learning
The event adjudications that you make improve the BluVector Sensor’s learning and accuracy. This section describes how to:
Set the automation level for Machine Learning Engine learning
Export classifiers
Import classifiers
Factory restore all classifiers
To configure learning, first navigate to the “Learning Configuration” Screen as follows:
Log in to the ATD GUI.
Select the sprocket icon at the top right.
Select Learning. The “Learning Configuration” Screen appears (see Figure: Learning Configuration Screen).
 Fig. 63: Learning Configuration Screen
The following sections describe the settings you can change from the Learning Configuration Screen, such as:
Configuring Machine Learning Engine Automation
You can set four levels of automation for the Machine Learning Engine:
Off: Disables learning on the BluVector Sensor.
Manual:
This setting requires user interactions for starting a retrain when there are enough eligible samples.
It requires user interactions for evaluating new candidate classifiers and accepting or rejecting retrains.
The user is notified when a filetype is eligible to retrain, as well as when there is a new candidate classifier to evaluate.
Automatically Learn:
With this setting, the BluVector Sensor automatically starts retraining a filetype when there are enough eligible samples.
It requires user interactions for evaluating new candidate classifiers and accepting or rejecting retrains.
The user is notified when a candidate classifier is ready for evaluation, or if there is a failure automatically starting a retrain.
Automatically Deploy:
This is the default automation level.
With this setting, the BluVector Sensor automatically starts retraining a filetype when there are enough eligible samples.
The BluVector Sensor automatically evaluates new candidate classifiers and automatically accepts or rejects the retrain.
The user is notified when a retrain has been automatically accepted or rejected, or if there is a failure in automatically starting or evaluating a retrain.
Procedure: Change the Automation Level for Learning
Follow these steps to change the learning automation level:
Navigate to the “Learning Configuration” Screen (see Section: Configuring Learning).
Select Hector from the menu that appears on the left. Hector is the Machine Learning Engine. The “Hector Learning Configuration” Screen appears (see Figure: Hector Learning Configuration Screen).
Move the slider to the desired automation level for learning.
Select Stage Changes.
 Fig. 64: Hector Learning Configuration Screen
Sharing Machine Learning Engine Classifiers
As a System Administrator or Lead Analyst, you may want to share custom retrained classifiers with other BluVector Sensors. This section describes how to export and import Machine Learning Engine classifiers from the ATD GUI.
Procedure: Export Machine Learning Engine Classifiers
Follow these steps to export classifiers
Note:
After completing this export, any previous exports will be unavailable for download.
Navigate to the “Learning Configuration” Screen (see Section: Configuring Learning).
Select Sharing. The “Learning Sharing Configuration” Screen appears (see Figure: Learning Sharing Configuration Screen).
 Fig. 65: Learning Sharing Configuration Screen
If classifiers were previously exported on this system, a link will appear above Export classifiers. Select the link to download the most recently generated archive of classifiers.
To generate a new archive of classifiers, select Export classifiers. It will take approximately 5-10 minutes to generate the archive.
Procedure: Import Machine Learning Engine Classifiers
Follow these steps to import classifiers.
Note:
Importing classifiers will cause irreversible loss of all locally trained classifiers. Additionally, all samples collected prior to the import of the classifiers will be ineligible for future retraining.
Navigate to the “Learning Configuration” Screen (see Section: Configuring Learning).
Select Sharing. The “Learning Sharing Configuration” Screen appears (see Figure: Learning Sharing Configuration Screen).
Select Import classifiers. The “Classifiers Import” Window appears (see Figure: Classifiers Import Window).
 Fig. 66: Classifiers Import Window
Select Choose File to select the archive to upload to the system.
Select Upload to start the import of the selected classifiers archive. The process will take approximately 5-10 minutes to complete.
Factory Restoring All Machine Learning Engine Classifiers
This section describes how to restore classifiers to the latest factory shipped versions. Restoring factory classifiers will cause irreversible loss of all locally trained classifiers. Additionally, all samples collected prior to the factory restore will be ineligible for future retraining.
Procedure: Factory Restore All Machine Learning Engine Classifiers
Follow these steps to restore all classifiers to the factory setting.
Navigate to the “Learning Configuration” Screen (see Section: Configuring Learning).
Select Sharing. The “Learning Sharing Configuration” Screen appears (see Figure: Learning Sharing Configuration Screen).
Select Factory restore all classifiers to restore all classifiers to their latest factory versions. The “Factory Restore All Classifiers” Window appears (see Figure: Factory Restore All Classifiers Window).
 Fig. 67: Factory Restore All Classifiers Window
Select Confirm to proceed.
Managing the Artifact Storage
BluVector ATD provides an Artifact Storage feature to manage files associated with the detection analytics and certain additional configurations within the system. It allows you to upload multiple files (artifacts) that have the same name from different sources for different types. You will specify what type the file is, where it should be used, and whether it is active or not. When a file is uploaded, BluVector ATD synchronizes the data across the ATD Central Manager and BluVector Sensor.
These components use the Artifact Storage feature:
Zeek Scripts - see Section: Configuring the Zeek Collection Engine
Suricata Rules & Threshold Uploads - see Section: Configuring the Suricata Collection Engine
ClamAV Signatures Management - see Section: Configuring the ClamAV Analyzer
Yara Rules Management - see Section: Configuring the Yara Analyzer
Machine Learning Engine Analyzer - see Section: Configuring the Machine Learning Engine Analyzer (Artifact Storage options are not configurable)
Smart Cards verification files for CA management - see Section Managing Smart Cards
The following fields, columns, and buttons are shown on screens that have configurable options for use with Artifact Storage:
Synchronize upstream - Determines whether Artifact Storage will pull down content from upstream for this component. The upstream source is typically the BluVector Portal, but it can also be an ATD Central Manager for a BluVector Collector.
This allows you to control for each component whether you want to manage the content yourself or to pull down content.
As an example, you could upload multiple Suricata rules files without using the Suricata files from the BluVector Portal, while still pulling down BluVector Portal content for ClamAV and Yara.
Search field - Filters the results
FILENAME column - Displays the name of the file
ACTIVE column - Indicates whether the file is currently active on a given system
SOURCE column - Displays where the file originated
LAST MODIFIED column - Shows the last time there was a change
ACTIONS column - Supports these actions:
Download icon - Allows you to download a file
Trash can icon - Removes a file
Upload File button - Adds a file
Restart button - Restarts the service after an update. The name of the button will match the component.
There may be additional columns that are specific to the component, such as a FILE TYPE column.
When you upload a file to Artifact Storage, you can select the locations that should have that file enabled. If no ATD Central Manager is present, the file is stored on the local BluVector Sensor.
An artifact synchronization indicator is shown above the artifact table on ATD Central Manager. This indicator shows whether or not artifacts have been successfully distributed and implemented on each collector.
Configuring Collection Engines
The BluVector Sensor uses several network processing, intrusion detection, and network security monitoring engines as part of its content extraction and event generation framework. This section describes how to configure the supported collection engines, including:
Zeek Network Security Monitor
Suricata Intrusion Detection System
First, navigate to the “Collectors Configuration” Screen to proceed, as follows:
Log in to the ATD GUI.
Select the sprocket icon at the top right.
Select Collectors. The “Collectors Configuration” Screen appears (see Figure: Collectors Configuration Screen).
The following sections describe the configuration procedures in more detail, including:
Configuring the Zeek Collection Engine
The Zeek Network Security Monitor is the BluVector Sensor’s primary network processing engine. It extracts the initial content, generates basic network events (before enrichment by content processing), and correlates intelligence indicators. You can configure its settings, which is described below.
Procedure: Configure the Zeek Collection Engine
Follow these steps to configure the Zeek Collection Engine settings:
Navigate to the “Collectors Configuration” Screen (see Section: Configuring Collection Engines).
Select Zeek Network Security Monitor. The “Zeek Network Security Monitor Configuration” Screen appears (see Figure: Zeek Network Security Monitor Configuration Screen).
 Fig. 68: Collectors Configuration Screen
 Fig. 69: Zeek Network Security Monitor Configuration Screen
To enable Zeek log generation, select Logging. To disable Zeek log generation, deselect Logging.
To enable deduplication of Zeek events, set the ‘Event Deduplication Window’ to a value of greater than zero. To disable deduplication of Zeek events, set the ‘Event Deduplication Window’ to zero.
Set the ‘Zeek Log Rotation’ interval by selected the desired number of minutes between log rotations from the drop-down menu.
Note:
Enabling event deduplication reduces the number of related events, particularly those generated by the intelligence framework. However, this may result in the occasional loss of supporting analytical information that is associated with these events. To minimize any potential impact, it is recommended to:
To save the configuration, select Stage Changes.
You may also upload custom Zeek scripts and manage the ones provided by BluVector. The uploaded files are maintained through the Artifact Storage. See Section: Managing the Artifact Storage for a description of this feature. The following procedure describes how to manage Zeek scripts.
Procedure: Add, Download, or Remove a Zeek Script
Follow these steps to add or remove a Zeek script:
Navigate to the “Collectors Configuration” Screen (see Section: Configuring Collection Engines).
Select Scripts Management in the menu that appears on the left. The “Scripts Management Configuration” Screen appears. (see Figure: Scripts Management Configuration Screen).
 Fig. 70: Scripts Management Configuration Screen
Select Upload File to select files from the local machine to upload. Zeek script files must have a
.zeekextension.Select the file to upload.
Select the locations that should have this file enabled.
Choose the filetype for the upload:
archive - Allows a group of associated scripts to be uploaded together. Archive files are tar or zip files that are extracted to produce scripts and/or passthrough files, or subdirectories of those files. This allows you to organize your files into subdirectories. The subdirectories are also added to the top-level
__load__.zeekfile, so you must include a__load__.zeekfile inside the subdirectory even if it contains no script files (in which case it would be empty).zeek script - Uploads and activates the file by adding the file to the top-level
__load__.zeek, so that Zeek loads it at start-up.passthrough - Uploads the file as-is and without any further processing. For example, you could first download the
networks.cfgfile and modify it to match your network, and then upload the changed file using the passthrough option. Another situation for choosing this option is if you want to upload input files containing formatted data that scripts read at runtime.
Select Upload.
Select Restart Zeek for the changes to take effect.
After uploading, the screen displays the current list of uploaded files. See Section: Managing the Artifact Storage for more information about the displayed columns. An additional column FILE TYPE displays the filetype, which can be changed.
You can download a file by selecting the download icon for that row.
To remove a file, select the trash can icon on the row containing the file you wish to remove. You will be asked to confirm the deletion.
Configuring the Suricata Collection Engine
The Suricata intrusion detection system requires frequent updates to its signatures to detect emerging threats. Informing Suricata about key network segments, such as all internal IP addresses, can help reduce false positives. The sections below describe various aspects for configuring the Suricata Collection Engine, including:
Configuring the networks
Uploading rules and threshold files
Leveraging the assisted tuning feature
Procedure: Configure the Suricata Networks
Follow these steps to configure the Suricata network settings:
Navigate to the “Collectors Configuration” Screen (see Section: Configuring Collection Engines).
Select Suricata in the menu that appears on the left. The “Suricata Configuration” Screen appears. (see Figure: Suricata Configuration Screen).
 Fig. 71: Suricata Configuration Screen
Enter comma-separated CIDR blocks for the following fields: Home Network, External Network, HTTP Servers, SMTP Servers, SQL Servers, DNS Servers, Telnet Servers, AIM Servers, DNP3 Servers, DNP3 Client, Modbus Servers, Modbus Client, ENIP Servers, and ENIP Client.
Many Suricata rules are directional, meaning they only hit when the alert occurs in traffic entering a particular network.
The most commonly used network in directional rules is the Home Network, since it identifies IP address space that is internal to the enterprise.
BluVector supports a maximum of 3,000 CIDR blocks.
The maximum number of characters for each field is 65,536.
Enter custom IP Group variables as key-value pairs where the key is the custom variable name and the value is one or more comma-separated CIDR blocks (e.g. “DMZ_NET” as the custom variable with value”10.10.1.0/24,10.20.1.0/24”). If more than one custom variable is needed click the Add button to get additional key-value inputs on the form.
Enter custom Port Group variables as key-value pairs where the key is the custom variable name and the value is one or more comma-separated port numbers. If more than one custom variable is needed click the Add button to get additional key-value inputs on the form.
Select Stage Changes.
Each network environment is different. The Suricata rule set provided by BluVector detects and identifies many possible threats and policy violations. Most users will find that tuning the rule set to their environment significantly reduces unwanted events. Individual rules should be removed from the system only after you are confident that the associated traffic is acceptable.
Suricata rule hits are managed with thresholds. Thresholds can be included in the rule, or they can be global. Global thresholds take precedence over those defined in a rule. There are several types of thresholds, such as rate_filter, suppress, and threshold. For detailed information about each threshold type and how to formulate the various threshold statements, see the Suricata thresholds documentation.
It is also possible to have a threshold that applies to all rules, which is referred to as a general threshold. A general threshold will have a sig_id of 0. Suricata will ignore invalid threshold strings.
When using an ATD Central Manager, you must manage rules for each BluVector Collector separately. You can select individual BluVector Collectors from the drop-down menu at the top of the screen in the blue banner. If you wish to have more centralized Suricata rules management, please contact your BluVector Customer Support engineer and inquire about the BluVector Enhanced Rules Management solution.
You may upload custom rules and threshold.config files for Suricata. Rules are upserted, meaning that if a rule already exists (the primary key is the rule’s signature ID), then multiple file uploads will only overwrite the fields that are different. If you are using BluVector-supplied rules, your new rules will merge with any preexisting rules already on the system. If you wish to use only your custom rules, you must disable automated rules updates from the “Suricata Configuration” Screen (see Section: Configuring the Suricata Collection Engine).
The uploaded files are maintained through the Artifact Storage. See Section: Managing the Artifact Storage for a description of this feature.
The procedure below describes how to upload custom rules and threshold files.
Procedure: Add, Download, or Remove Suricata Rules and Threshold Files
Follow these steps to upload a Suricata rule or threshold.config file:
Navigate to the “Collectors Configuration” Screen (see Section: Configuring Collection Engines).
Select Rules & Threshold Management in the menu that appears on the left. The Suricata “Rules and Threshold Management” Screen appears (see Figure: Suricata Rules and Threshold Management Screen).
 Fig. 72: Suricata Rules and Threshold Management Screen
Select Upload File to select files from the local machine to upload.
Select the file to upload.
Select the locations that should have this file enabled.
Choose the filetype for the upload:
rule - a list of Suricata signatures to use for detection
threshold - instructions on how to handle Suricata rule hits that include deduplication, suppression, and thresholding
Select Upload.
Select Restart Suricata for the changes to take effect.
After uploading, the screen displays the current list of uploaded files. See Section: Managing the Artifact Storage for more information about the displayed columns. An additional column FILE TYPE displays the filetype, which can be changed.
You can download a file by selecting the download icon for that row.
To remove a file, select the trash can icon on the row containing the file you wish to remove. You will be asked to confirm the deletion.
The following procedure describes how to leverage assisted tuning for Suricata. For more information about the assisted tuning feature, see Section: Understanding Assisted Suricata Tuning.
Procedure: Leverage Suricata Assisted Tuning
Follow these steps to leverage the assisted tuning feature for Suricata:
Navigate to the “Collectors Configuration” Screen (see Section: Configuring Collection Engines).
Select Tuning Assistant in the menu that appears on the left. The Suricata “Tuning Assistant” Screen appears (see Figure: Suricata Tuning Assistant Screen).
 Fig. 73: Suricata Tuning Assistant Screen
Specify the following information in preparation for generating the system recommendations:
Tuning Start Date: Enter the starting date to search for generating recommendations.
Tuning Stop Date: Enter the ending date to search for generating recommendations.
Tuning Level: Drag the slider to represent your risk tolerance. A conservative approach reduces less noise, but it preserves more detection sensitivity. An aggressive approach provides greater noise reduction at the expense of detection sensitivity. If you select Custom, you will be able to edit the following fields:
Max hits per signature: Enter the maximum average daily signature hit rate before disabling the signature. The daily average is calculated over the full length of the tuning window.
Max hits per (Signature, Source IP) pairs: Enter the maximum average daily (sid, src_ip) hit rate before tuning out the pair. The daily average is calculated over the full length of the tuning window.
Specificity Ratio: Enter a percentage. (Signature, Source IP) pairs will be favored if they account for at least this percentage of hits. Lower percentages make using (Signature, Source IP) pairs more likely. Values must be between 0 and 1 (inclusive).
Max unique source IPs: Enter the maximum number of unique source IPs to threshold per signature before disabling the entire signature.
Select Get Recommendations to review the system suggestions for (Signature, Source IP) pairs to suppress or disable in order to reduce noise. You can then accept or reject each individual recommendation. You can also take time to do further investigation before accepting or rejecting a recommendation.
Select Apply Recommendations.
Configuring the Speculative Code Execution Engine Collector
The Speculative Code Execution Engine is a collector that uses machine learning technology to extract potentially malicious JavaScript and HTML files out of the network stream and send them through ATD for further analysis. It extracts and decrypts obfuscated shellcode and presents it to the user in plain text. It provides insight into JavaScript variables and their corresponding values, obtained during the JavaScript emulation.
You can enable or disable the Speculative Code Execution Engine, adjust the maximum number of bytes to analyze, and configure an allow list to cut down on unwanted files. This collector is enabled by default. The procedure below describes how to configure the settings.
Procedure: Configure the Speculative Code Execution Engine Collector
Follow these steps to configure the Speculative Code Execution Engine settings:
Navigate to the “Collectors Configuration” Screen (see Section: Configuring Collection Engines).
Select NEMA. NEMA is the Speculative Code Execution Engine. The “NEMA Configuration” Screen appears (see Figure: NEMA Configuration Screen).
 Fig. 74: NEMA Configuration Screen
To enable the Speculative Code Execution Engine, choose NEMA Correlator Enabled. To disable it, clear NEMA Correlator Enabled.
To change the maximum number of bytes to analyze while looking for files, change the value in the ‘Maximum bytes for NEMA to analyze’ field.
You can configure an allow list, which is comma separated list that accepts: ipv4/6 cidr blocks, ipv4/6 addresses, hostnames, and wildcard host names using the Allow List field.
To save the configuration, select Stage Changes.
Configuring BluVector Sensor Analyzers
As the BluVector Sensor ingests network traffic and reassembles content, files are distributed to embedded analyzers. The analyzers within the BluVector Sensor are:
ClamAV: An open-source and signature-based antivirus engine
Extractor: An archive decompressor that resubmits embedded files into the system for analysis
Geolocation: An enrichment service that provides geolocation information based on IP addresses
Hector Machine Learning Engine: A model-based static analyzer that uses machine learning techniques to classify files as benign or malicious
hURI: A high-speed URL analytic that identifies suspicious URLs
IntelLookup: A high-speed module that correlates BluVector metadata against external intelligence feeds
IOCHunter: An enrichment engine that identifies potential indicators (such as URLs and email addresses) in file and emails
NEMA Speculative Code Execution Engine: A machine learning and heuristics-based analyzer that detects suspicious shellcode and JavaScript
Yara: A rule-based malware identification and classification utility
You can configure the analyzers in the following ways:
Define flaggable criteria
Enable or disable analyzers
Subscribe or unsubscribe analyzers from various filetypes
Adjust Machine Learning Engine thresholds that classify content as malicious or benign
Upload ClamAV signatures
Manage Yara rules
To configure the analyzers, first bring up the “Analyzers Configuration” Screen as follows:
Log in to the ATD GUI.
Select the sprocket icon at the top right. The “Analyzers Configuration” Screen appears (see Figure: Analyzers Configuration Screen).
See the following sections for more information:
Section: Configuring the ClamAV Analyzer
Section: Configuring the Extractor Analyzer
Section: Configuring the Geolocation Analyzer
Section: Configuring the hURI Analyzer
Section: Configuring the IntelLookup Analyzer
Section: Configuring the IOCHunter Analyzer
Section: Configuring the Speculative Code Execution Engine Collector
Section: Configuring the Yara Analyzer
 Fig. 75: Analyzers Configuration Screen
Configuring General Analyzer Settings
The analyzers embedded within the BluVector Sensor will flag content as being suspicious according to a set of categories. You can configure which categories to use. When the analyzers flag content, they serve as an important system component because:
Flagged content is saved to disk and can be downloaded through the ATD GUI.
Events associated with flagged content automatically receive a status of Suspicious.
The default system behavior is to only flag content based on a finding of suspiciousness by an analyzer. You may, however, elect to extend flagging to include content that fails to complete analysis. Failure to complete analysis could be due to either the sample causing an issue (which results in a file warning), or the analysis engine encountering an unexpected error and failing to complete its analysis (which results in an analyzer error). To extend the flagging of suspicious content, follow the steps below.
Procedure: Extend Flagging of Files that Failed Analysis
Follow these steps to also flag files that failed analysis:
Navigate to the “Analyzers Configuration” Screen (see Section: Configuring BluVector Sensor Analyzers).
Select General. The “General Analyzers Configuration” Screen appears (see Figure: General Analyzers Configuration Screen).
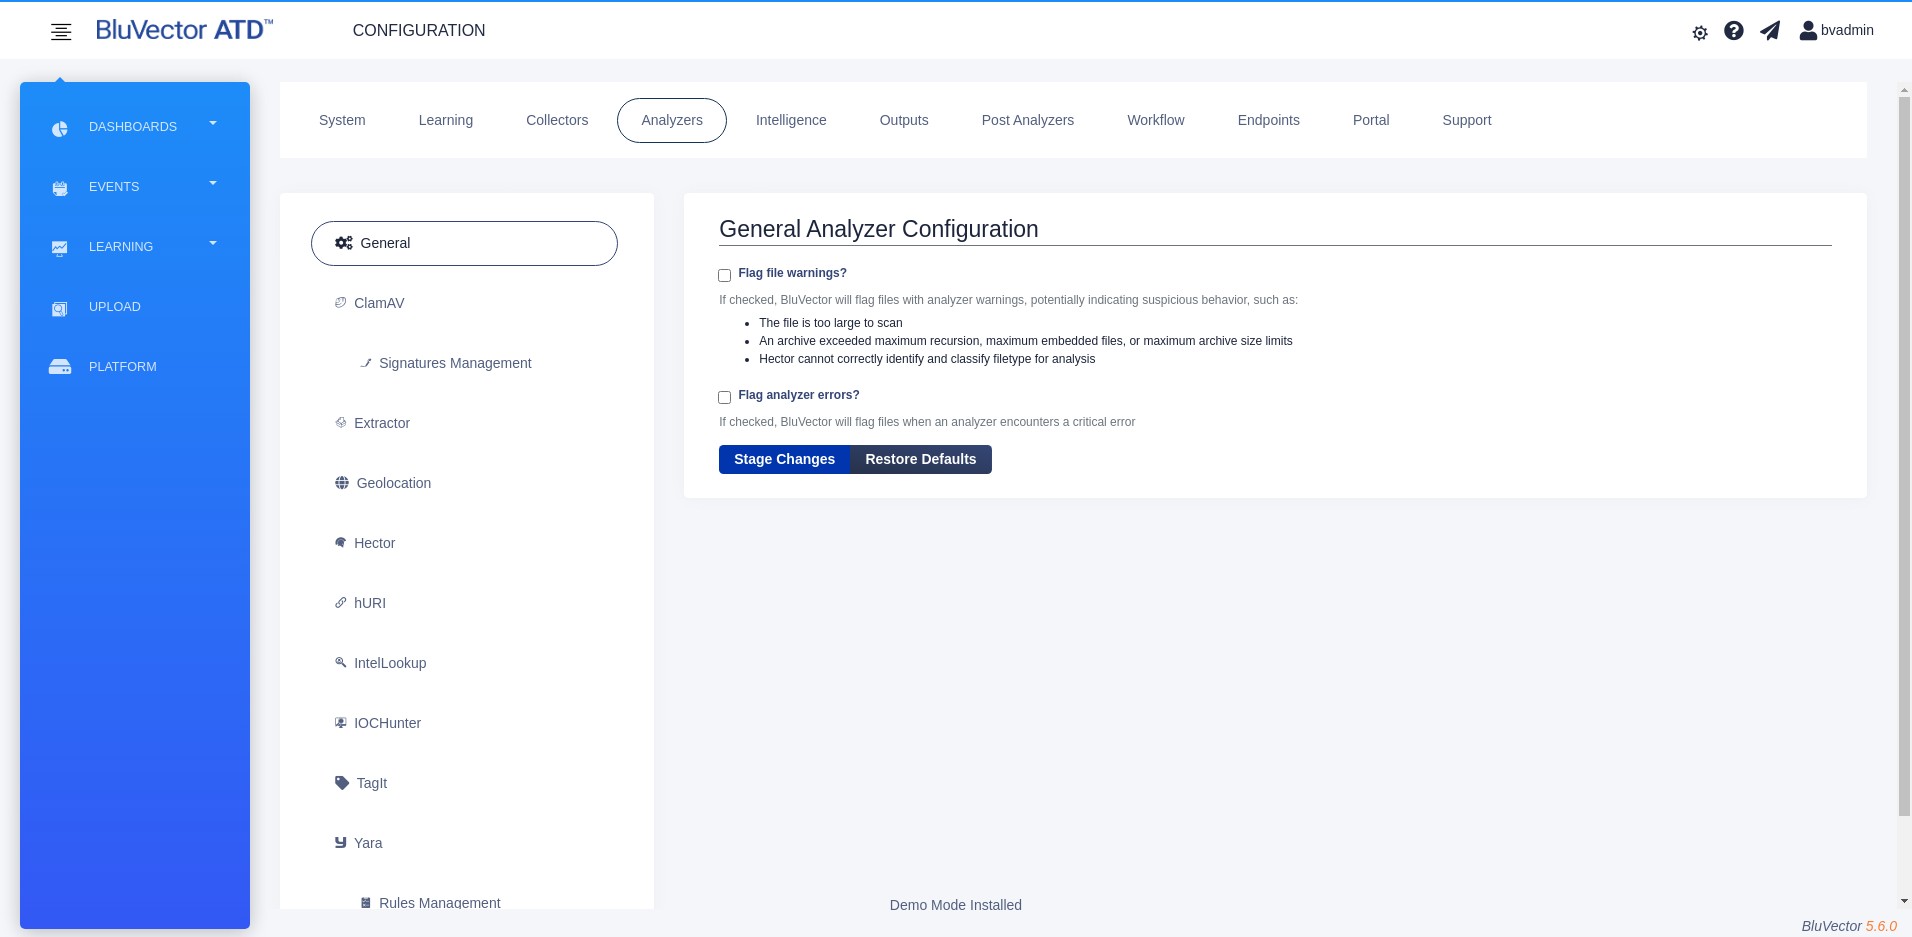
Fig. 76: General Analyzers Configuration Screen
To extend flagging to files that failed due to a file warning, choose Flag file warnings?
To extend flagging to analyzer errors, choose Flag analyzer errors?
Select Stage Changes.
Configuring the ClamAV Analyzer
ClamAV is an open source signature-based malware detector. When a file is discovered to be malicious, a signature can be written to uniquely identify that piece of malware. When the ClamAV Analyzer inspects a file, it checks the file against hundreds of thousands of known malware signatures. If there is a match, the result of ClamAV’s analysis will contain the signature that was present in the analyzed sample. New and custom ClamAV signatures can be uploaded through the configuration screen to keep the signatures updated. Alternatively, BluVector Sensors with BluVector Portal access will automatically fetch the latest ClamAV signatures. See Clamav document for more information about ClamAV.
You can enable or disable ClamAV, subscribe to or unsubscribe from a filetype, and update ClamAV with the latest signatures. You can also install additional ClamAV signatures. These procedures are described below. This analyzer is enabled by default.
Procedure: Configure the ClamAV Analyzer
Follow these steps to configure the ClamAV settings:
Navigate to the “Analyzers Configuration” Screen (see Section: Configuring BluVector Sensor Analyzers).
Select ClamAV. The “ClamAV Configuration” Screen appears (see Figure: ClamAV Configuration Screen).
 Fig. 77: ClamAV Configuration Screen
To enable ClamAv, choose Enabled. To disable ClamAV, clear Enabled.
The Analyzed File Types section shows a list of filetypes. To subscribe ClamAV to a filetype, select the appropriate filetype. To unsubscribe ClamAV from a filetype, deselect the filetype.
To save the configuration, select Stage Changes.
Procedure: Add, Download, or Remove ClamAV Signatures
The uploaded files are maintained through the Artifact Storage. See Section: Managing the Artifact Storage for a description of this feature. Follow these steps to update the ClamAV signatures:
Navigate to the “Analyzers Configuration” Screen (see Section: Configuring BluVector Sensor Analyzers).
Select ClamAV. The “ClamAV Configuration” Screen appears (see Figure: ClamAV Configuration Screen)
Select Signatures Management from the menu that appears on the left. The ClamAv “Signatures Management” Screen appears (see Figure: ClamAV Signature Management Screen).
 Fig. 78: ClamAV Signature Management Screen
Select Upload File to select files from the local machine to upload.
Select the file to upload.
Select the locations that should have this file enabled.
Select Upload.
Select Restart ClamAV for the changes to take effect.
After uploading, the screen displays the current list of uploaded files. See Section: Managing the Artifact Storage for more information about the displayed columns.
You can download a file by selecting the download icon for that row.
To remove a file, select the trash can icon on the row containing the file you wish to remove. You will be asked to confirm the deletion.
Configuring the Extractor Analyzer
The Extractor Analyzer decompresses archive files and republishes the embedded artifacts into the system for analysis. It will only republish the filetypes that are subscribed to by other analyzers. For example, if none of the analyzers are subscribed to the Android APKs filetype, the extractor will not republish embedded Android APKs, and those files will not be analyzed by the system. Parent-child relationships are preserved when files are republished, and their analysis results are stored in the same event. The analyzer is also cognizant of recursion (archives with embedded archive files). You can adjust the maximum number of embedded files, maximum embedded files, and the maximum recursion limit.
The Extractor Analyzer can also generate child objects from certain filetypes. Child objects are files of a different type that are embedded in another file, often of a different filetype. For example, it is possible to embed an executable inside a Microsoft Office document. You can configure the analyzer to treat parent objects as archives and to republish embedded child objects for further analysis.
You can enable or disable the Extractor Analyzer, subscribe to or unsubscribe from filetypes, and configure other settings. These procedures are described below. This analyzer is enabled by default.
Procedure: Configure the Extractor Analyzer
Follow these steps to configure the Extractor settings:
Navigate to the “Analyzers Configuration” Screen (see Section: Configuring BluVector Sensor Analyzers).
Select Extractor. The “Extractor Configuration” Screen appears (see Figure: Extractor Configuration Screen).
 Fig. 79: Extractor Configuration Screen
To enable Extractor, choose Enabled. To disable Extractor, clear Enabled.
The Analyzed Extraction File Types section shows a list of filetypes. To subscribe Extractor to a filetype, select the appropriate filetype. To unsubscribe Extractor from a filetype, deselect the filetype.
Below the Analyzed Extraction File Types section, the Object Extraction File Types section shows another list of filetypes. To enable embedded object extraction for a filetype, select the appropriate filetype. To unsubscribe embedded object extraction, deselect the filetype.
Below the Object Extraction File Types section, there are more settings. To enable or disable passwordcracking for zipped files, select or clear Crack Password Protected Zip. This capability attempts to decrypt zipped files for the purpose of extracting content using a small list of commonly used passwords.
To limit the amount of content extracted from a given archive, set the Maximum Embedded Size (in bytes), Max Embedded Files, and Recursion Limit by entering the desired values in the appropriate fields.
To enable dynamic password recovery for encrypted email attachments, select or clear Enable Dynamic Password Recovery. This capability searches for potential passwords in email bodies for encrypted archives sent as email attachments.
To constrain the runtime of dynamic password recovery, define a timeout in seconds in Archive Decryption and Extraction Timeout.
To store email bodies used in the event record, select a condition for Save Email Bodies to determine when to save email bodies.
To save the configuration, select Stage Changes.
Configuring the Geolocation Analyzer
The Geolocation Analyzer is a service that provides geolocation information based on IP addresses. When this analyzer is enabled, the associated country flags will appear next to the destination and source IP addresses in the Event Viewer and in the “Event Details” Screen (see Section: Using the Event Viewer and Section: Using the Event Details Screen). You can also create a dashboard widget to display geolocation metrics (see Section: Customizing Dashboard Widgets).
You can enable or disable the Geolocation Analyzer. You can change the update schedule for the geolocation data source, as the information about countries may change over time. The followed procedure describes these steps.
Procedure: Configure the Geolocation Analyzer
Follow these steps to configure the Geolocation Analyzer settings:
Navigate to the “Analyzers Configuration” Screen (see Section: Configuring BluVector Sensor Analyzers).
Select Geolocation. The “Geolocation Configuration” Screen appears (see Figure: Geolocation Configuration Screen). A banner shows the last time that the geolocation database was updated.
 Fig. 80: Geolocation Configuration Screen
To enable geolocation enrichment for events, choose Enabled. To disable geolocation enrichment, clear Enabled.
Enter the ‘Maximum missed updates’. After the system has missed this number of database updates, the information will be considered stale, and geolocation enrichment will no longer appear. The default value of 0 indicates that the database will never be considered stale, and geolocation information will continue to appear indefinitely.
Enter the ‘Length between updates’ for the geolocation data. The default number of days is 7.
To save the configuration, select Stage Changes.
Configuring the Machine Learning Engine Analyzer
The Machine Learning Engine makes probabilistic determinations as to whether files are considered benign or malicious. This analyzer is made up of several classifiers, which analyze very specific filetypes. For example, there could be 12 different classifiers covering portable executables alone. The result of analysis by the Machine Learning Engine is a confidence score between zero and 100.
Scores closer to 100 indicate more malicious characteristics.
Scores closer to zero indicate more benign characteristics.
Each classifier has an associated threshold. A file with a score above this threshold is flagged as suspicious, otherwise it is declared benign.
The configuration screen will display the recommended decision thresholds for each classifier. You can adjust the thresholds, based on your risk appetite. For example, a nuclear power firm may be inclined to lower the recommended thresholds, in order to not miss a single false negative. For some organizations, this risk reduction may be worth the expense of possibly producing more false positives.
In order to evaluate files, the Machine Learning Engine extracts a wide variety of metadata that is specific to each filetype. From the configuration screen, you can select how much of the human-readable metadata to retrain as part of the event. The following options are available for how much metadata to include for each filetype:
Disabled: No analysis will be performed on this filetype.
Analyze - No Metadata: The Machine Learning Engine will produce only a score.
Analyze - Standard Metadata: The Machine Learning Engine will produce a score and include humanreadable metadata fields of interest to a typical analyst.
Analyze - Verbose Metadata: The Machine Learning Engine will produce a score and include all humanreadable metadata fields. Only the Standard Metadata fields will be displayed in the ATD GUI, but all fields will be available in the raw event metadata.
The procedure below describes how to enable or disable the Machine Learning Engine, adjust decision thresholds, and subscribe to or unsubscribe from filetypes. This analyzer is enabled by default.
Procedure: Configure the Machine Learning Engine Analyzer
Follow these steps to configure the Machine Learning Engine Analyzer settings:
Navigate to the “Analyzers Configuration” Screen (see Section: Configuring BluVector Sensor Analyzers).
Select Hector. Hector is the Machine Learning Engine. The “Hector Configuration” Screen appears (see Figure: Hector Configuration Screen).
 Fig. 81: Hector Configuration Screen
To enable the Machine Learning Engine, choose Enabled. To disable the Machine Learning Engine, clear Enabled.
The Analysis Levels section displays various filetypes, along with their analysis levels. To subscribe the Machine Learning Engine to a filetype, select the appropriate analysis level for that filetype. To unsubscribe from a filetype, set its analysis level to Disabled.
Below the Analysis Levels section, you will see a Models section. There are sliders for each filetype. Move the sliders to adjust the thresholds for malicious flagging. A higher threshold requires a higher score to be declared malicious, which then reduces the number of flagged events. A higher threshold, however, risks the possibility of increased false negatives (missed malware). The recommended threshold varies for each classifier. Note that a single BluVector filetype may correspond to multiple fine-grained Machine Learning Engine filetypes.
To save the configuration, select Stage Changes.
For more information in general about configuring analyzers and the overall categories of flagged content, see Section: Configuring BluVector Sensor Analyzers.
Configuring the hURI Analyzer
The hURI Analyzer uses machine learning techniques to detect potentially malicious URIs. Similar to the Machine Learning Engine, the result of hURI’s analysis is a confidence level between zero and 100.
Scores closer to 100 indicate more malicious characteristics.
Scores closer to zero indicate more benign characteristics.
The analyzer uses a single classifier and has a recommended suspicious threshold of 50. A URI with a score above this threshold is flagged, otherwise it is declared benign. The configuration screen will display the recommended decision threshold for the classifier. You can adjust the threshold, based on your risk appetite.
You can enable or disable the hURI Analyzer, set the number of hURI processes, and set the decision threshold. These procedures are described below.
Procedure: Configure the hURI Analyzer
Follow these steps to configure the hURI settings:
Navigate to the “Analyzers Configuration” Screen (see Section: Configuring BluVector Sensor Analyzers).
Select hURI. The “hURI Configuration” Screen appears (see Figure: hURI Configuration Screen).
 Fig. 82: hURI Configuration Screen
To enable hURI, choose Enabled. To disable hURI, clear Enabled.
Set the threshold for classifying URIs as malicious by moving the Suspicious Threshold slider to the desired threshold.
To save the configuration, select Stage Changes.
Configuring the IntelLookup Analyzer
The IntelLookup Analyzer is the engine that correlates event and file metadata with threat intelligence sources. If there is an intelligence hit, the result of IntelLookup’s analysis is a dictionary that varies by intelligence provider. If no intelligence providers are configured in the system, there will not be any intelligence hits. You can configure threat intelligence feeds and view intelligence indicator metrics on the configuration screen.
You can enable or disable the IntelLookup Analyzer and subscribe to or unsubscribe from an event type. These procedures are described below.
Procedure: Configure the IntelLookup Analyzer
Follow these steps to configure the IntelLookup Analyzer settings:
Navigate to the “Analyzers Configuration” Screen (see Section: Configuring BluVector Sensor Analyzers).
Select IntelLookup. The “IntelLookup Configuration” Screen appears (see Figure: IntelLookup Configuration Screen).
 Fig. 83: IntelLookup Configuration Screen
To enable IntelLookup, choose Enabled. To disable IntelLookup, clear Enabled. This analyzer is enabled by default.
The Analyzed Event Types section shows a list of event types. IntelLookup can analyze any BluVector event type. To enable lookups on a particular event type, select the appropriate event type. To unsubscribe IntelLookup from an event type, deselect the event type.
bv_event_intel refers to intelligence correlation at the event level (such as IP addresses and hostnames)
bv_event_file refers to intelligence correlation at the file level (for example, MD5 and SHA256 hashes)
bv_event_user refers to user-defined events based on custom Zeek scripts
5. To save the configuration, select Stage Changes.
Configuring the IOCHunter Analyzer
The IOCHunter Analyzer enriches file metadata by extracting potentially interesting indicators from the file binary, such as URLs and email addresses. These indicators can be used to enhance understanding while analyzing an event or as inputs to custom rules.
You can enable or disable the IOCHunter Analyzer and subscribe to or unsubscribe from a filetype. These procedures are described below.
Procedure: Configure the IOCHunter Analyzer
Follow these steps to configure the IOCHunter settings:
Navigate to the “Analyzers Configuration” Screen (see Section: Configuring BluVector Sensor Analyzers).
Select IOCHunter. The “IOCHunter Configuration” Screen appears (see Figure: IOCHunter Configuration Screen).
 Fig. 84: IOCHunter Configuration Screen
To enable IOCHunter, choose Enabled. To disable IOCHunter, clear Enabled.
The Analyzed File Types section shows a list of filetypes. IOCs will only be extracted from the selected filetypes. To subscribe IOCHunter to a filetype, select the appropriate filetype. To unsubscribe IOCHunter from a filetype, deselect the filetype.
To save the configuration, select Stage Changes.
Configuring the Yara Analyzer
Yara is a rule-based utility that is primarily used to classify and identify malware samples. The rules consist of textual or binary patterns and hit on content that exhibits the matching criteria. Multiple rules can hit on the same piece of content that is being analyzed. By default, the BluVector Sensor does not ship with any Yara rules. You can add rules using the command-line or the BluVector API. See Yara Document for more information about Yara.
You can enable or disable the Yara Analyzer, subscribe to or unsubscribe from a filetype, and set the number of Yara processes. This analyzer is enabled by default. These procedures are described below.
Procedure: Configure the Yara Analyzer
Follow these steps to configure the Yara settings:
Navigate to the “Analyzers Configuration” Screen (see Section: Configuring BluVector Sensor Analyzers).
Select Yara. The “Yara Configuration” Screen appears (see Figure: Yara Configuration Screen).
 Fig. 85: Yara Configuration Screen
To enable Yara, choose Enabled. To disable Yara, clear Enabled.
The Analyzed File Types section shows a list of filetypes. To subscribe Yara to a filetype, select the appropriate filetype. To unsubscribe Yara from a filetype, deselect the filetype.
To save the configuration, select Stage Changes.
You may also upload custom Yara rules and manage those provided by BluVector. The uploaded files are maintained through the Artifact Storage. See Section: Managing the Artifact Storage for a description of this feature. The following procedure provides more explanation on how to upload Yara rules.
Procedure: Add, Download, or Remove Yara Rules
Follow these steps to update the Yara rules:
Navigate to the “Analyzers Configuration” Screen (see Section: Configuring BluVector Sensor Analyzers).
Select Yara. The “Yara Configuration” Screen appears (see Figure: Yara Configuration Screen).
Select Rules Management in the menu that appears on the left. The “Yara Rules Management” Screen appears (see Figure: Yara Rules Management Screen).
 Fig. 86: Yara Rules Management Screen
Select Upload File to select files from the local machine to upload.
Select the file to upload.
Select the locations that should have this file enabled.
Choose the filetype for the upload from the list of options.
Select Upload.
Select Restart Yara for the changes to take effect.
After uploading, the screen displays the current list of uploaded files. See Section: Managing the Artifact Storage for more information about the displayed columns. An additional column FILE TYPE displays the filetype, which can be changed.
You can download a file by selecting the download icon for that row.
To remove a file, select the trash can icon on the row containing the file you wish to remove. You will be asked to confirm the deletion.
Configuring Threat Intelligence Providers
The BluVector Sensor supports third-party threat intelligence providers. The system has built-in support for several providers. In addition to commercial third-party threat intelligence feeds, BluVector also supports several community standards for sharing cyber threat intelligence. You can configure the providers.
Note that you must license your own access credentials in order to configure an intelligence provider. Each configuration procedure includes a link to the provider’s website.
This section documents the following configuration procedures for the third-party threat intelligence providers that are built into the BluVector Sensor:
Entering licensed access credentials that are required
Enabling intelligence providers
Changing the update frequency of the intelligence data (optional)
Changing the intelligence signature attributes (optional)
First, navigate to the “Intelligence Configuration” Screen to proceed, as follows:
Log in to the ATD GUI.
Select the sprocket icon at the top right.
Select Intelligence. The “Intelligence Configuration” Screen appears (see Figure: Intelligence Configuration Screen)
 Fig. 87: Intelligence Configuration Screen
On this screen, you can view metrics information of the threat intelligence indicators that currently exist within the system. You can manage an allowlist to reduce the number of possible false positives, and you can configure the various intelligence providers. See the following sections for more information:
Section: Configuring the Allowlist
Configuring the Allowlist
You may want to mark certain domains, hashes, or IPs (v4 or v6) as safe in order to reduce the number of possible false positives from intelligence reporting. Any BluVector ATD events containing these values will not generate any Intel results. The following procedure describes how to add and remove allowlist entries.
Procedure: Add Entries to the Allowlist
Follow these steps to add entries to the allowlist:
Navigate to the “Intelligence Configuration” Screen (see Section: Configuring Threat Intelligence Providers).
Select General. The “Allowlist Configuration” Screen appears (see Figure: Allowlist Configuration Screen).
 Fig. 88: Allowlist Configuration Screen
The current entries in the allowlist are displayed, organized by Domain, Hash, and IP.
To add a new item, select Add Allowed Item. You will be asked for more details.
In the ‘Item Type’ field, select whether you are entering a safe domain, hash, or IP.
In the ‘Allow Item’ field, enter the text or numbers for the entry.
Select Add to complete the entry.
You can immediately enter additional items, or you can close the popup window by selecting the X at the top of that window.
Procedure: Remove an Entry from the Allowlist
Follow these steps to remove an entry from the allowlist:
Navigate to the “Intelligence Configuration” Screen (see Section: Configuring Threat Intelligence Providers).
Select General. The “Allowlist Configuration” Screen appears (see Figure: Allowlist Configuration Screen).
Locate the entry you wish to remove. Select the trash can icon for that row.
You will be asked to confirm the deletion.
Configuring AlienVault OTX Intelligence Provider
You can configure a BluVector Sensor to use the free, open source threat intelligence feed provided by AlienVault at OTX document. You must register with AlienVault to receive an API key. The following procedure describes how to configure this feed.
Procedure: Configure AlienVault OTX Intelligence Provider
Follow these steps to configure the AlienVault OTX settings:
Navigate to the “Intelligence Configuration” Screen (see Section: Configuring Threat Intelligence Providers).
Select Alien Vault OTX. The “AlienVault OTX Intelligence Configuration” Screen appears (see Figure: AlienVault OTX Intelligence Configuration Screen).
 Fig. 89: AlienVault OTX Intelligence Configuration Screen
To activate the service, select Provider Enabled.
If you are using a proxy, first configure the proxy in BluVector ATD Host (see Section: Configuring System Proxies). Then select Use Proxy.
Enter a number of days in the ‘Time to Live (days)’ field. After this many days following receipt of the intelligence, the system will no longer use the information.
Enter the host information into the ‘Host’ field.
Enter your API key received from AlienVault in the ‘API Key’ field.
In the ‘Max number of days to look back for signatures’ field, enter the maximum days to search in the past for signatures. Enter 0 to look back for an unlimited time.
In the ‘Max number of pages to look back for signatures’ field, enter the maximum pages to search in the past. Enter 0 to look back for an unlimited time.
You can select Test Connectivity in order to test the connection to the provider and inform you whether it passed or failed.
Select Stage Changes to apply and save the updated configuration.
Configuring a STIX/TAXII Intelligence Provider
You can configure a BluVector Sensor to use the STIX/TAXII Intelligence Provider available at Oasis documentation. This service provides custom and community cyber threat intelligence. Structured Threat Information Expression (STIX) is a language and serialization format used to exchange cyber threat intelligence. Trusted Automated Exchange of Intelligence Information (TAXII) is an application layer protocol for communicating cyber threat information in a simple and scalable manner over HTTPS. TAXII enables organizations to share cyber threat intelligence by defining an API that aligns with common sharing models. TAXII is specifically designed to support the exchange of cyber threat intelligence represented in STIX.
The BluVector Sensor supports the integration of multiple STIX/TAXII feeds. Each feed must be configured separately. The following procedure describes how to configure this feed.
Procedure: Configure STIX/TAXII Intelligence Provider
Follow these steps to configure the STIX/TAXII settings:
Navigate to the “Intelligence Configuration” Screen (see Section: Configuring Threat Intelligence Providers).
Select TAXII. The “TAXII Services Intelligence Configuration” Screen appears (see Figure: TAXII Configuration Screen).
 Fig. 90: TAXII Configuration Screen
Enter a name for this TAXII feed in the ‘Name’ field.
To activate the service, select Provider Enabled.
If you are using a proxy, first configure the proxy in BluVector ATD Host (see Section: Configuring System Proxies). Then select Use Proxy.
Enter a number of days in the ‘Time to Live (days)’ field. After this many days following receipt of the intelligence, the system will no longer use the information.
Enter the host information into the ‘Host’ field.
Enter the username into the ‘Username’ field.
Enter the password into the ‘Password’ field.
You can select Test Connectivity in order to test the connection to the TAXII server and inform you whether it passed or failed.
Select Stage Changes to apply and save the updated configuration.
Configuring a MISP Intelligence Provider
You can configure a BluVector Sensor to use the MISP Intelligence Provider available at the MISP website. This service is an open source cyber threat intelligence sharing platform. You must acquire access credentials before starting this configuration procedure.
Procedure: Configure the MISP Intelligence Provider
Follow these steps to configure the MISP settings:
Navigate to the “Intelligence Configuration” Screen (see Section: Configuring Threat Intelligence Providers).
Select MISP. The “MISP Intelligence Configuration” Screen appears (see Figure: MISP Configuration Screen).
 Fig. 91: MISP Configuration Screen
Enter a name for the MISP feed in the ‘Name’ field.
To activate the service, select Provider Enabled.
If you are using a proxy, first configure the proxy in BluVector ATD Host (see Section: Configuring System Proxies). Then select Use Proxy.
Enter a number of days in the ‘Time to Live (days)’ field. After this many days following receipt of the intelligence, the system will no longer use the information.
Enter the host information into the ‘Host’ field.
Enter your API key in the ‘API Key’ field to authenticate with the provider.
Configure the number of seconds to search back for attributes (that is, intelligence IoCs) in the ‘Look Back Time (Sec)’ field.
In the ‘Record Limit’ field, enter the maximum number of records in the response for records from this intelligence provider.
The ‘Verify Certificate’ field controls whether or not to accept a self-signed SSL certificate from the server supplying this intelligence. Enter True to reject a self-signed certificate. Enter False to bypass the validation step.
You can select Test Connectivity in order to test the connection to the MISP server and inform you whether it passed or failed.
Select Stage Changes to apply and save the updated configuration.
Configuring Outputs
A very flexible and transparent framework for sending messages to external devices is natively built into the BluVector Sensor. The messages encompass a subset of event and file metadata, based on user-defined key mappings. Messages can be created in several different formats and transmitted over a variety of different protocols. The most common use case is to route syslog messages to SIEM tools when the BluVector Sensor detects a suspicious event on the network.
First, navigate to the “Outputs Configuration” Screen to proceed, as follows:
Log in to the ATD GUI.
Select the sprocket icon at the top right.
Select Outputs. The “Outputs Configuration” Screen appears (see Figure: Outputs Configuration Screen).
 Fig. 92: Outputs Configuration Screen
See the following sections for how to configure:
Section: Configuring and Using Key Mappings
Section: Configuring Event Forwarding
Section: Configuring Zeek Forwarding
Section: Configuring DataBee Forwarding
Section: Configuring an Email Output
Section: Configuring a File Upload Output
Section: Configuring a Kafka Output
Configuring and Using Key Mappings
It is helpful to develop custom key mappings. It allows you to transform the keys in the BluVector event schema to be consistent with external devices that ingest data from multiple sources. User-defined key maps allow you to send messages to SIEM tools in a particular structure, so that they can be effectively used for event correlation and incident response. Each of the keys in the BluVector event schema can be re-mapped to alternate key names as desired.
To bring up the Key Mappings Outputs Configuration Screen:
Navigate to the “Outputs Configuration” Screen (see Section: Configuring Outputs).
Select Key Mappings. The “Key Mapping Configuration” Screen appears (see Figure: Key Mappings Configuration Screen).
 Fig. 93: Key Mappings Configuration Screen
The default mapping details appear, along with any other mappings. The mapping details can be expanded or contracted. You can create, modify, and delete key mappings from the “Key Mappings Configuration” Screen. The procedures below describe how to manage the mappings.
Procedure: Create a Key Map
Follow these steps to create a new output key map:
Navigate to the “Key Mappings Configuration” Screen (see Figure: Key Mappings Configuration Screen).
Select Add New at the very bottom of the screen. A new set of mapping details appears. The fields will be prefilled with default values.
Enter a new map name for ‘Name’.
Modify the existing mapping details by replacing field entries in the list.
Delete a row by selecting the trash can for the appropriate row.
To add a row, click Add on the bottom and fill in the fields.
When you are finished, select Stage Changes or Cancel, as appropriate.
Procedure: View or Edit a Key Map
Follow these steps to view or edit an existing output key map.
Navigate to the “Key Mappings Configuration” Screen (see Figure: Key Mappings Configuration Screen).
Select down caret on the title row for the key map name you wish to view or edit. The details of the mapping appear in a list.
Modify the existing mappings by entering new information into the appropriate fields in the list.
Delete mappings by selecting the trash can for the appropriate row.
To add mappings, select Add at the bottom of the list and fill in the fields.
When you are finished, select Stage Changes or Cancel, as appropriate.
Procedure: Deleting a Key Map
Follow these steps to delete a key map from the BluVector Sensor. Deleted key maps are not archived and cannot be restored.
Navigate to the “Key Mappings Configuration” Screen (see Figure: Key Mappings Configuration Screen).
Select the down caret on the title row for the key map name you wish to delete. The details of the mapping appear in a list.
Select Delete at the bottom of the list.
When you are finished, click the Stage Changes or Cancel button on the bottom, as appropriate.
Configuring Event Forwarding
Event forwarding sends complete BluVector events over a network to a different host. A BluVector event consists of the event metadata and, optionally, the binary file content associated with the event. Events are sent using the 0MQ distributed messaging bus and are in BSON format. A 0MQ listener must be available to receive the events. Multiple event forwarding outputs may be configured. See ZeroMQ website for more information about 0MQ.
You can enable or disable event forwarding, decide whether to include binary file content, and manage other settings. These are described in the following procedure.
Procedure: Configure Event Forwarding
Follow these steps to configure the event forwarding settings:
Navigate to the “Outputs Configuration” Screen (see Section: Configuring Outputs).
Select Event Forwarding. The “Event Forwarding Outputs Configuration” Screen appears (see Figure: Event Forwarding Outputs Configuration Screen).
 Fig. 94: Event Forwarding Outputs Configuration Screen
The event forwarding output details appear. The output details can be expanded or contracted.
To create a new event forwarding output, make sure that the title row displays New Item. If necessary, select Add New at the very bottom of the screen. Then enter the appropriate information, described in the following steps.
To enable the output, select Send Events. To disable the output, clear Send Events.
To include the binary file content associated with an event, select Forward file content. To not include the binary content, clear Forward file content.
Enter the desired values in the following fields:
Enter a name for ‘Output Name’.
Set a unique identifier key name for this event forwarder by entering the desired string for ‘Unique Identifier Key’. To include a unique identifier with each forwarded event, select Include Unique Identifier. The unique identifier string will appear in the event under the key name provided for ‘Unique Identifier Key’.
Set a target address by entering the hostname or IP address in the ‘Target’ field. The target represents the address of the external device that will be receiving the generated 0MQ messages.
Enter the port number in the ‘Port’ field.
To include the fully qualified domain name (FQDN) in the output for events, select Include fqdn in the output under the sensor_hostname key, for JSON, CSV, or LEGACY_CSV formats.
Enter the output routing criteria in the ‘Output routing criteria’ field. This criteria is equivalent to the queries that drive the Event Viewer (see Section: Searching Events with Queries). For example, to generate messages on all files flagged by the Machine Learning Engine over the SMTP protocol (note that SMTP messages are translated to the EML format), you would type:
files.flags=='hector' and meta.app=='eml'
To add another event forwarding output, select Add New at the very bottom of the screen, then repeat the above steps.
You can view the details for a particular event forwarding output by selecting the down caret on the title row.
To delete an event forwarding output, select Delete.
To save your new settings, select Stage Changes.
Configuring Zeek Forwarding
Zeek forwarding sends Zeek logs associated with a BluVector event to a Kafka broker. Only Zeek logs that have the same community id as the BluVector event are sent. This is a small subset of the targeted logs for that event.
Procedure: Configure Zeek Forwarding
Follow these steps to configure the Zeek forwarding settings:
Navigate to the “Outputs Configuration” Screen (see Section: Configuring Outputs).
Select Zeek Forwarding in the menu that appears on the left. The “Zeek Output Configuration” Screen appears (see Figure: Zeek Forwarding Output Configuration Screen).
 Fig. 95: Zeek Forwarding Output Configuration Screen
Select Integration Enabled to enable this output.
Select Debug Logging Enabled to enable more verbose logging output.
Enter the desired values in the following fields:
Enter the desired name for the ‘Integration Name’.
Enter the output routing criteria in the ‘Integration Routing Criteria’ field. This criteria is equivalent to the queries that drive the Event Viewer (see Section: Searching Events with Queries). For example, to generate messages on all files flagged by the Machine Learning Engine over the SMTP protocol (note that SMTP messages are translated to the EML format), you would type:
files.flags=='hector' and meta.app=='eml'Another example entry would be:
(suricata != None and suricata == exists(true)) or status > "review"In ‘Kafka Broker’, enter a Kafka bootstrap server (also known as a broker) that the client should use for your Kafka cluster. Entries should be in host:port format.
Enter the topic name for the events in ‘Kafka Topic’.
In the ‘Security Protocol’ field, select either PLAINTEXT or SSL as the security protocol to use when communicating.
Paste the contents of the client certificate into the ‘Client Certificate’ field.
If you are using SSL, you will need to paste both the client key and client certificate. Enter the client key in the ‘Client Key’ field.
If your Client Key requires a password, enter the password into the ‘Client Password’ field.
To bypass verifying the remote certificate when connecting, select Skip TLS Verification.
Paste the contents of the remote certificate into the ‘Remote Certificate’ field.
Apply and save the new settings by selecting Stage Changes at the bottom of the screen.
To add another Zeek Forwarding output, select Add New at the very bottom of the screen, and then repeat the above steps.
To delete a Zeek Forwarding output, select Delete to the right of the output name, and then select Stage Changes.
Configuring DataBee Forwarding
DataBee is a companion product to BluVector ATD. You can forward both Zeek network telemetry and detection event data from BluVector ATD to DataBee to automate hunting for threats that may have breached your network. See Section: Protecting with BluVector Products for more information about how the products work together.
The procedure below provides more details on how to configure BluVector ATD to forward data to DataBee.
Procedure: Configure DataBee Event Forwarding
Follow these steps to configure forwarding of detection events to DataBee:
Navigate to the “Outputs Configuration” Screen (see Section: Configuring Outputs).
Select Databee Event Forwarding in the menu that appears on the left. The “DataBee Event Forwarding Configuration” Screen appears (see Figure: DataBee Event Forwarding Configuration Screen).
 Fig. 96: DataBee Event Forwarding Configuration Screen
Select Send Events to enable DataBee Event Forwarding.
Enter a unique ‘Output Name’ that does not conflict with any other BluVector ATD output names.
Select whether or not you want to use the configured proxy.
Enter the ‘Endpoint URL’ for the target DataBee server. This can be found by logging into DataBee, opening the system configuration, and selecting HTTP Collector, then copy the Endpoint URL into this field.
Enter the ‘API Key’ generated when setting up the BluVector Detection Events data feed in DataBee.
Enter the ‘Tenant ID’ for the BluVector Detection Events data feed in DataBee.
Enter the ‘Source ID’ for the BluVector Detection Events data feed in DataBee.
In the ‘Output Routing Criteria’ field, enter a selector for which events to output. For example, you might enter:
(suricata != None and suricata == exists(true)) or status >= "suspicious"Apply and save the new settings by selecting Stage Changes at the bottom of the screen.
Procedure: Configure DataBee Zeek Forwarding
Follow these steps to configure forwarding of Zeek logs to DataBee:
Navigate to the “Outputs Configuration” Screen (see Section: Configuring Outputs).
Select DataBee Zeek Forwarding in the menu that appears on the left. The “DataBee Zeek Forwarding Configuration” Screen appears (see Figure: DataBee Zeek Forwarding Configuration Screen).
 Fig. 97: DataBee Zeek Forwarding Configuration Screen
Select Send Zeek Logs to AWS S3 to enable DataBee Zeek Forwarding.
Select whether or not to use the configured proxy.
Enter the ‘AWS S3 Zeek Bucket Path’ for the S3 bucket where the logs will be written.
Enter the ‘AWS S3 Region’ where the S3 bucket exists.
Enter the ‘Amazon Resource Name (ARN) of IAM Role’ for the IAM Role that can write to the S3 bucket.
Enter the ‘AWS S3 Access Key ID’ if applicable.
Enter the ‘AWS S3 Secret Access Key’ if applicable.
Enter the ‘AWS S3 Session Token’ if applicable.
In the Included Logs section, select the Zeek logs you wish to forward to DataBee.
Apply and save the new settings by selecting Stage Changes at the bottom of the screen.
Configuring a Generic TCP/UDP or Syslog Output
Messages about BluVector alerts and events can be sent in raw TCP or UDP format.
TCP is a connection-oriented and reliable transport layer protocol.
UDP is a connection-less and unreliable transport layer protocol.
Syslog is a standard for message logging, and it is a critical component of conducting event correlation and incident response within Security Operations Centers (SOCs).
The BluVector Sensor has an output utility that permits you to generate and transmit messages based on userdefined routing criteria (for example, if the Machine Learning Engine detects a suspicious executable over SMTP). You can add, modify, or delete a TCP/UDP output. The procedure below provides more details.
Procedure: Configure a TCP/UDP Output
Follow these steps to configure a TCP/UDP output:
Navigate to the “Outputs Configuration” Screen (see Section: Configuring Outputs).
Select TCP/UDP in the menu that appears on the left. The “TCP/UDP or Syslog Outputs Configuration” Screen appears (see Figure: TCP/UDP or Syslog Outputs Configuration Screen).
 Fig. 98: TCP/UDP or Syslog Outputs Configuration Screen
Select Send Events to enable this output to send BluVector detection events.
Enter the desired name for the ‘Output Name’.
In the ‘Format’ field, select one of the following formats:
Common Event Format
Comma Separated Values
JSON
Legacy Comma Separated Values
Syslog forwarded events with a json message field
Select Send Alerts to use this output to send health and status alert messages.
Enter a hostname or IP address for the ‘Hostname or IP address on which the socket is connected’ field.
Enter the port number for ‘Port’.
Select Include Unique Identifier to include the ‘Output Name’ in the message for events.
Enter a unique identifier key string in the ‘Unique Identifier Key’ field. This key will be used in the output to map to the Unique Identifier (applies only to events). It is recommended to enter
channel.To include the fully qualified domain name (FQDN) in the output for events, select Include fqdn in the output under the sensor_hostname key, for JSON, CSV, or LEGACY_CSV formats.
Select a choice for the Key map. You can define your own to add to this list:
default
ath_output
splunkmapping
Enter the output routing criteria in the ‘Output Routing Criteria’ field. This criteria is equivalent to the queries that drive the Event Viewer (see Section: Searching Events with Queries). For example, to generate messages on all files flagged by the Machine Learning Engine over the SMTP protocol (note that SMTP messages are translated to the EML format), you would type:
files.flags=='hector' and meta.app=='eml'Another example entry would be:
status>='suspicious'Select a protocol for ‘Protocol’. You can choose between TCP and UDP.
Select what type of program is logging the message in the ‘Facility’ field. You can choose from many options.
Select a priority for the message in the ‘Priority’ field. You can choose from many options.
Select Send as SysLog to format the message to be consumed by a syslog service.
To encrypt communications using TLS, select Enable SSL/TLS communication.
Select the version for ‘TLS Version’, which can be either v1.1 or v1.2.
You can select Test Connectivity in order to test the connection and inform you whether it passed or failed.
Apply and save the new settings by selecting Stage Changes.
To add another TCP/UDP output, select Add New at the very bottom of the screen, and then repeat the above steps.
To delete a TCP/UDP output, select Delete, and then select Stage Changes.
Configuring an Email Output
Messages about BluVector events can be sent as emails. You may elect to send matching system events, health and status alerts, or both. The procedure below provides more details.
Procedure: Configure an Email Output
Follow these steps to configure an email output:
Navigate to the “Outputs Configuration” Screen (see Section: Configuring Outputs).
Select Email in the menu that appears on the left. The “Email Output Configuration” Screen appears (see Figure: Email Output Configuration Screen).
 Fig. 99: Email Output Configuration Screen
Select Send Events to enable this output to send events.
Select Send Alerts to use this output to send health and status alerts.
Enter the desired values in the following fields:
Enter the desired name for the ‘Output Name’.
To include the fully qualified domain name (FQDN) in the output for events, select Include fqdn in the output under the sensor_hostname key, for JSON, CSV, or LEGACY_CSV formats.
You may select a custom or default key map for ‘Key Map’. Messages are structured in the default key map by default.
Enter the ‘Hostname or IP address of the SMTP server’ to use to send the email.
Enter the ‘Port that the SMTP gateway listens to’, typically 587.
Enter the ‘SMTP User for authentication’ and ‘Password of the SMTP user’ for the account from which to send the email.
Enter the ‘Email address for origination’, which is used to populate the ‘From’ field of the email.
To set a list of recipients, enter a comma-separated list of email addresses in the ‘List of email addresses to send to’ field.
Enter the output routing criteria in the ‘Output Routing Criteria’ field. This criteria is equivalent to the queries that drive the Event Viewer (see Section: Searching Events with Queries). For example, to generate messages on all files flagged by the Machine Learning Engine over the SMTP protocol (note that SMTP messages are translated to the EML format), you would type:
files.flags=='hector' and meta.app=='eml'
You can select Test Connectivity in order to test the connection and inform you whether it passed or failed.
Apply and save the new settings by selecting Stage Changes at the bottom of the screen.
To add another email output, select Add New at the very bottom of the screen, and then repeat the above steps.
To delete an email output, select Delete, then click the Stage Changes.
Configuring a File Upload Output
A File Upload output allows the file binary associated with select BluVector events to be sent over the network to another system. No metadata regarding the file is transmitted. If you want to send the file content and metadata, consider an Event Forwarding Output instead. Files are transmitted using the secure file transfer protocol (SFTP). This method requires account login information for a user with SFTP capabilities on the destination machine. It is recommended to create a new user that only has SFTP access on the destination system. Files will be stored using a tree structure associated with the sha256 of the file, starting at the base of the configured directory. If no directory is configured, the user’s configured home directory will be used. For example, a file with the sha256 of: bacaf76cd3cf101269e4703880398c1363749a314c0db29c1f9afb6879a5babc would be stored in the following location:
/home/sftpuser/b/a/c/a/bacaf76cd3cf101269e4703880398c1363749a314c0db29c1 f9afb6879a5babc
The procedure below describes how to manage file uploads.
Procedure: Configure a File Upload Output
Follow these steps to configure a File Upload output:
Navigate to the “Outputs Configuration” Screen (see Section: Configuring Outputs).
Select File Upload in the menu that appears on the left. The “File Upload Output Configuration” Screen appears. (see Figure: File Upload Output Configuration Screen).
 Fig. 100: File Upload Output Configuration Screen
Select Send Events to enable this output.
Type the desired values in the following fields:
Enter the desired name for the ‘Output Name’.
Enter the hostname or IP address in ‘Target’ with the address of the external device that will be receiving the SFTP traffic.
Enter a port number in the ‘Port’ field.
To include the fully qualified domain name (FQDN) in the output for events, select Include fqdn in the output under the sensor_hostname key, for JSON, CSV, or LEGACY_CSV formats.
Enter the target directory name in ‘Upload Directory’.
Enter the username for the remote system in ‘Username’.
Enter the password for the remote system in ‘Password’.
Enter the output routing criteria in the ‘Output Routing Criteria’ field. This criteria is equivalent to the queries that drive the Event Viewer (see Section: Searching Events with Queries). For example, to generate messages on all files flagged by the Machine Learning Engine over the SMTP protocol (note that SMTP messages are translated to the EML format), you would type:
files.flags=='hector' and meta.app=='eml'
Apply and save the new settings by selecting Stage Changes at the bottom of the screen.
To add another File Upload output, select Add New at the very bottom of the screen, and then repeat the above steps.
To delete a File Upload output, select Delete to the right of the output name, and then select Stage Changes.
Configuring a Kafka Output
Kafka is an open-source message broker that builds real-time data pipelines. Messages can be posted to Kafka topics, and subscribers of those topics can read the messages. See the Kafka website for more information about Kafka.
You can add, modify, or delete a Kafka output. The procedure below provides more details.
Procedure: Configure a Kafka Output
Navigate to the “Outputs Configuration” Screen (see Section: Configuring Outputs).
Select Kafka in the menu that appears on the left. The “Kafka Output Configuration” Screen appears (see Figure: Kafka Output Configuration Screen).
 Fig. 101: Kafka Output Configuration Screen
Select Send Events to enable this output.
Enter the desired values in the following fields:
Enter the desired name for the ‘Output Name’.
To include the Output Name in the output for events, select Include Unique Identifier.
Enter a value for ‘Keymap’, such as
ath_output.Enter the output routing criteria in the ‘Output Routing Criteria’ field. This criteria is equivalent to the queries that drive the Event Viewer (see Section: Searching Events with Queries). For example, to generate messages on all files flagged by the Machine Learning Engine over the SMTP protocol (note that SMTP messages are translated to the EML format), you would type:
files.flags=='hector' and meta.app=='eml'Another example entry would be:
(suricata != None and suricata == exists(true)) or status > "review"In ‘Kafka Boot Strap Servers’, enter a list of Kafka bootstrap servers (also known as brokers) that the client should use for your Kafka cluster. Entries should be in host:port format.
Enter the topic name for the events in ‘Kafka Topic’.
In the ‘Security Protocol’ field, select either PLAINTEXT or SSL as the security protocol to use when communicating.
Paste the contents of the client certificate into the ‘Client Certificate’ field.
If you are using SSL, you will need to paste both the client key and client certificate. Enter the client key in the ‘Client Key’ field.
If your Client Key requires a password, enter the password into the ‘Client Password’ field.
To bypass verifying the remote certificate when connecting, select Skip TLS Verification.
Paste the contents of the remote certificate into the ‘Remote Certificate’ field.
Apply and save the new settings by selecting Stage Changes at the bottom of the screen.
To add another Kafka output, select Add New at the very bottom of the screen, and then repeat the above steps.
To delete a Kafka output, select Delete to the right of the output name, and then select Stage Changes.
Configuring a Kafka Output for Zeek Logs
You can also send a BluVector Sensor’s Zeek logs to a Kafka message broker. Because Zeek’s Kafka plug-in is highly configurable, you must configure it through a Zeek script. The plug-in is already installed on the BluVector Sensor. To configure it, upload your Zeek script following the instructions in Section: Configuring the Zeek Collection Engine. Below are a few example templates. Additional templates and details about the plug-in are available on the Zeek Kafka Plugin Github Page at: Kafka plugin Documentation.
Example 1: Send All Zeek Logs that Match Log Names
Follow this example to send all Zeek logs to topic names that match the log names, such as conn, http, and files:
The topic_name value must be set to an empty string.
Any configuration value accepted by librdkafka can be added to the kafka_conf configuration table.
The
metadata.broker.listshould be updated with your Kafka broker host:port pairs
Listing 1: Example 1: Kafka Zeek Plug-in Template (all logs)
@load Apache/Kafka
redef Kafka::topic_name = "";
redef Kafka::tag_json = F;
redef Kafka::kafka_conf = table(
["metadata.broker.list"] = "kafka:9092"
);
redef Kafka::send_all_active_logs = T;
Example 2: Send a Subset of Zeek Logs that Match Log Names
Follow this example to send a subset of Zeek logs to topic names that match the log names.
Listing 2: Example 2: Kafka Zeek Plug-in Template (subset of logs)
@load Apache/Kafka
redef Kafka::topic_name = "";
redef Kafka::tag_json = F;
redef Kafka::kafka_conf = table(
["metadata.broker.list"] = "kafka:9092"
);
redef Kafka::send_all_active_logs = F;
redef Kafka::logs_to_send = set(Conn::LOG, SMTP::LOG, Files::LOG);
Example 3: Send HTTPS and DNS Logs to Custom Topic Names
Follow this example to sending HTTP and DNS logs to custom topic names.
The $path value of Zeek’s Log Writer mechanism defines the topic name.
Any configuration value accepted by librdkafka can be added to the $config configuration table.
Each log writer accepts a separate configuration table.
Listing 3: Example 3: Kafka Zeek Plug-in Template (custom topic names)
@load Apache/Kafka
redef Kafka::topic_name = "";
redef Kafka::tag_json = F;
redef Kafka::kafka_conf = table(
["metadata.broker.list"] = "localhost:9092"
);
event zeek_init() &priority=-10
{
# handles HTTP
local http_filter: Log::Filter = [
$name = "kafka-http",
$writer = Log::WRITER_KAFKAWRITER,
$config = table(
["metadata.broker.list"] = "localhost:9092"
),
$path = "custom-topic-http"
];
Log::add_filter(HTTP::LOG, http_filter);
# handles DNS
local dns_filter: Log::Filter = [
$name = "kafka-dns",
$writer = Log::WRITER_KAFKAWRITER,
$config = table(
["metadata.broker.list"] = "localhost:9092"
),
$path = "custom-topic-dns"
];
Log::add_filter(DNS::LOG, dns_filter);
}
If SSL communication with the Kafka message broker is required, users must stage three files on the BluVector ATD Host: The CA root certificate, the Kafka client certificate, and the Kafka client key. These are available from the Kafka broker. Once the files are staged in the ingest container (recommendations are for the CA root certificate to go in: ingest:/etc/pki/ca-trust; the client certificate in: ingest:/etc/pki/tls/ certs; and the client key in: ingest:/etc/pki/tls/private), then add the appropriate values to the Kafka::kafka_conf variable defined in the Zeek script. An example is provided below:
Listing 4: Enabling SSL in Kafka Zeek Plug-in
redef Kafka::kafka_conf = table(
["ssl.ca.location"] = "/etc/pki/ca-trust/<name-of-ca-file.pem>",
["ssl.certificate.location"] =
"/etc/pki/tls/certs/<name-of-client-certificate-file.pem>",
["ssl.key.location"] =
"/etc/pki/tls/private/<name-of-client-key-file.pem>",
["security.protocol"] = "ssl",
["metadata.broker.list"] = "<fqdn-of-broker>:9092"
);
Configuring Post Analyzers
The post analyzer framework built into the BluVector Sensor submits files and events to secondary sources for additional processing, after BluVector initially analyzes them. The BluVector Sensor acts as a first-stage filter. The secondary sources are called post analyzers. The BluVector Sensor sends suspicious files to the post analyzers to retrieve dynamic analysis results, including virtual execution in a sandbox environment. You may need to obtain subscriptions or access credentials from the supported third parties.
You can configure the post analyzers by following the procedures in this section. First, navigate to the “Post Analyzer Configuration” Screen to proceed, as follows:
Log in to the ATD GUI.
Select the sprocket icon at the top right.
Select Post Analyzers. The “Post Analyzers Configuration” Screen appears (see Figure: Post Analyzers Configuration Screen).
 Fig. 102: Post Analyzers Configuration Screen
For more details, see the following sections:
Section: Configuring BluVector Dynamic Malware Analysis in the Cloud
Section: conf_pa_fireeye
Configuring BluVector Dynamic Malware Analysis in the Cloud
BluVector provides a cloud-based sandbox called BluVector Dynamic Malware Analysis in the Cloud. This post analyzer correlates activity across multiple Threat Vectors and attack stages in order to analyze the full context of an attack. You can then rapidly triage the event properly, based on this information. The ATD GUI provides a single view of the event using this analysis. Dynamic execution analysis results can typically take between 10 to 300 seconds.
This post analyzer determines what the malware would do if it were executed. For example, the malware might contain ransomware, create additional bots, perform credential farming, or be destructive. BluVector Dynamic Malware Analysis in the Cloud determines the intent and tactics of the attack. It uses a patented program analysis tool (binary rewriter) that analyzes and changes binary code while running in a simulated environment.
BluVector Dynamic Malware Analysis in the Cloud adds additional context to the captured malware, making it possible for you to gain a deep understanding of how the malware was constructed. The contextual data includes network telemetry, indicators of compromise, process execution, remote calls, and service execution (including execution sequence).
Using BluVector Dynamic Malware Analysis in the Cloud reduces false positives. The BluVector Sensor only forwards files considered Suspicious or Malicious, and it does not send previously analyzed files or detections already confirmed by threat intelligence.
You can configure BluVector Dynamic Malware Analysis in the Cloud through the following procedure.
The procedure below describes how to configure this post analyzer.
Procedure: Configure BluVector Dynamic Malware Analysis in the Cloud
Follow these steps to configure BluVector Dynamic Malware Analysis in the Cloud:
Navigate to the “Post Analyzers Configuration” Screen (see Section: Configuring Post Analyzers).
Select Dynamic Malware Analysis in the menu that appears on the left. The “Dynamic Malware Analysis Configuration” Screen appears (see Figure: Dynamic Malware Analysis Configuration Screen).
 Fig. 103: Dynamic Malware Analysis Configuration Screen
Select Enabled.
If you are using a proxy, select Use Proxy. Ensure that the proxy is configured in the BluVector ATD Host.
Enter the desired routing criteria in ‘Routing Criteria’. Routing criteria determines what content is sent to the sandbox. By default, only content flagged by one of the BluVector high-speed analyzers will be sent. Any valid query statement may be used as routing criteria.
Select Stage Changes.
Understanding Performance Considerations
The Targeted Logger Post Analyzer buffers and filters the high volume of logs generated by Zeek, while maintaining a balance between the other resource constraints of the BluVector Sensor. As a result, its performance directly correlates to the nature of the network traffic being observed. For instance, a tap containing a high volume of short-lived HTTP sessions can result in exponentially more log generation than one that is composed more of large file transfers or streaming application load. It is important to properly configure the BluVector Sensor to reflect the load placed on it for a particular traffic profile.
Configuring Workflows
BluVector provides a workflow for interacting with events. The BluVector System automatically adjudicates, prioritizes and groups events for analyst review. An overall event score is assigned to each suspicious event. The overall score is based on the highest score received among all the records generated by that event.
The records are derived from the network events that are viewable in the Event Viewer (see Figure: Event Viewer). The system automatically collects records into categories called Threat Vectors. A unique record is created when an event-content pairing matches the query terms defined for a Threat Vector. If an event contains no content, then a record is based solely on the event metadata (see Section: Understanding Data Schemas for more information). Every record is scored, based on the weighted sum of customizable scoring factors.
The system provides Hunt Scoring and Threat Vector features that you can customize. To proceed, bring up the “Workflow Configuration” Screen as follows:
Log in to the ATD GUI.
Select the sprocket icon at the top right.
Select Workflow. The “Workflow Configuration” Screen appears.
The following sections describe how to:
Establish and edit rules for adjudicating events
Enable and disable Hunt Scoring and Threat Vectors
Customize the Hunt Equation and individual Threat Vector scoring equations
Create, edit, and delete Threat Vectors
Change how Threat Vectors categories are visually grouped on the Overview Dashboard (see Figure: Overview Dashboard)
For more details, see the following sections:
Section: Configuring Event Rules
Section: Configuring Hunt Scoring
Section: Configuring Threat Vectors
Configuring Event Rules
The BluVector System can automatically adjudicate events based on a set of rules. Each rule’s query term decides whether a particular event matches the rule. You may use any valid query as a query term.
Each rule also has an action. Available actions are:
drop: Do not record the event. No post-analysis will be performed.
status-trusted: Set the event status to trusted.
status-info: Set the event status to info.
status-suspicious: Set the event status to suspicious.
status-malicious: Set the event status to malicious.
status-review: Set the event status to review.
Rules can optionally also set the file status of files contained within the events. Files adjudicated by rule are not included in the BluVector learning processes.
The following procedures describe how to manage rules for events, view the recent statistics for a rule, and change a rule’s priority.
Procedure: Add or Edit a Rule
Follow these steps to add or edit an event rule:
Navigate to the “Workflow Configuration” Screen (see Section: Configuring Workflows).
Select Event Workflow in the menu that appears on the left. The “Event Workflow Configuration” Screen appears (see Figure: Event Workflow Configuration Screen).
 Fig. 104: Event Workflow Configuration Screen
The rules are arranged in movable sections that can be expanded. To edit an existing rule, navigate to find it.
To add a new rule, scroll to the very bottom of the screen and select Add New.
Enter the rule’s ‘Query’ term and a ‘Description’.
Select an ‘Action’.
To enable the rule, select Active.
To apply the rule to both event and file statuses, select Include Files.
Select Stage Changes.
Procedure: Delete or Disable a Rule
Follow these steps to delete or disable an event rule:
Navigate to the “Workflow Configuration” Screen (see Section: Configuring Workflows).
Select Event Workflow in the menu that appears on the left. The “Event Workflow Configuration” Screen appears (see Figure: Event Workflow Configuration Screen).
Find the rule you wish to delete or disable.
Expand the rule to show its details.
To remove the rule, select Delete in that rule’s section.
To disable the rule, deselect Active. Disabled rules are maintained for future use.
Select Stage Changes.
Procedure: View the Recent Statistics for a Rule
For each rule, you can view its statistics over the last five days to provide a sense of how often the rule is likely to be applied in the future. Follow these steps to view the last five days of statistics for an event rule:
Navigate to the “Workflow Configuration” Screen (see Section: Configuring Workflows).
Select Event Workflow in the menu that appears on the left. The “Event Workflow Configuration” Screen appears (see Figure: Event Workflow Configuration Screen).
Find the rule you wish to view.
Expand the rule to show its details.
Select Rule Statistics. The “Rule Impact Assessment” Window appears (see Figure: Rule Impact Assessment Window).
 Fig. 105: Rule Impact Assessment Window
Procedure: Changing Rule Priority
Rule order matters for evaluating events. BluVector evaluates the rules from highest priority to lowest. The “Event Workflow Configuration” Screen displays the highest priority rules first at the top of the screen. BluVector applies the first rule to match an event, and further lower priority rules will not be applied. Follow these steps to change the priority of an event rule:
Navigate to the “Workflow Configuration” Screen (see Section: Configuring Workflows).
Select Event Workflow in the menu that appears on the left. The “Event Workflow Configuration” Screen appears (see Figure: Event Workflow Configuration Screen).
The rules are arranged in movable sections. To edit an existing rule, navigate to find it.
Drag the left menu area for that rule to change its desired position relative to all of the other rules. The rule priority is highest at the top of the screen.
Select Stage Changes.
Configuring Hunt Scoring
When the BluVector System suspects that an event is suspicious or malicious, it assigns the event a prioritization value, called a Hunt Score. Hunt Scores range in value from 0 (lowest priority) to a user-configurable maximum score (highest priority). The default maximum score is 10. BluVector uses a default set of scoring factors called the Hunt Equation to calculate a record’s score. The Hunt Equation scoring factors are superseded by any configured Threat Vectors-specific scoring factors.
The following procedures describe how to configure the Hunt Score calculation.
Procedure: Configure the Hunt Score Calculation
Follow these steps to configure the calculation of the Hunt Score:
Navigate to the “Workflow Configuration” Screen (see Section: Configuring Workflows).
Select Hunt Score in the menu that appears on the left. The “Hunt Scoring Configuration” Screen appears (see Figure: Hunt Scoring Configuration Screen).
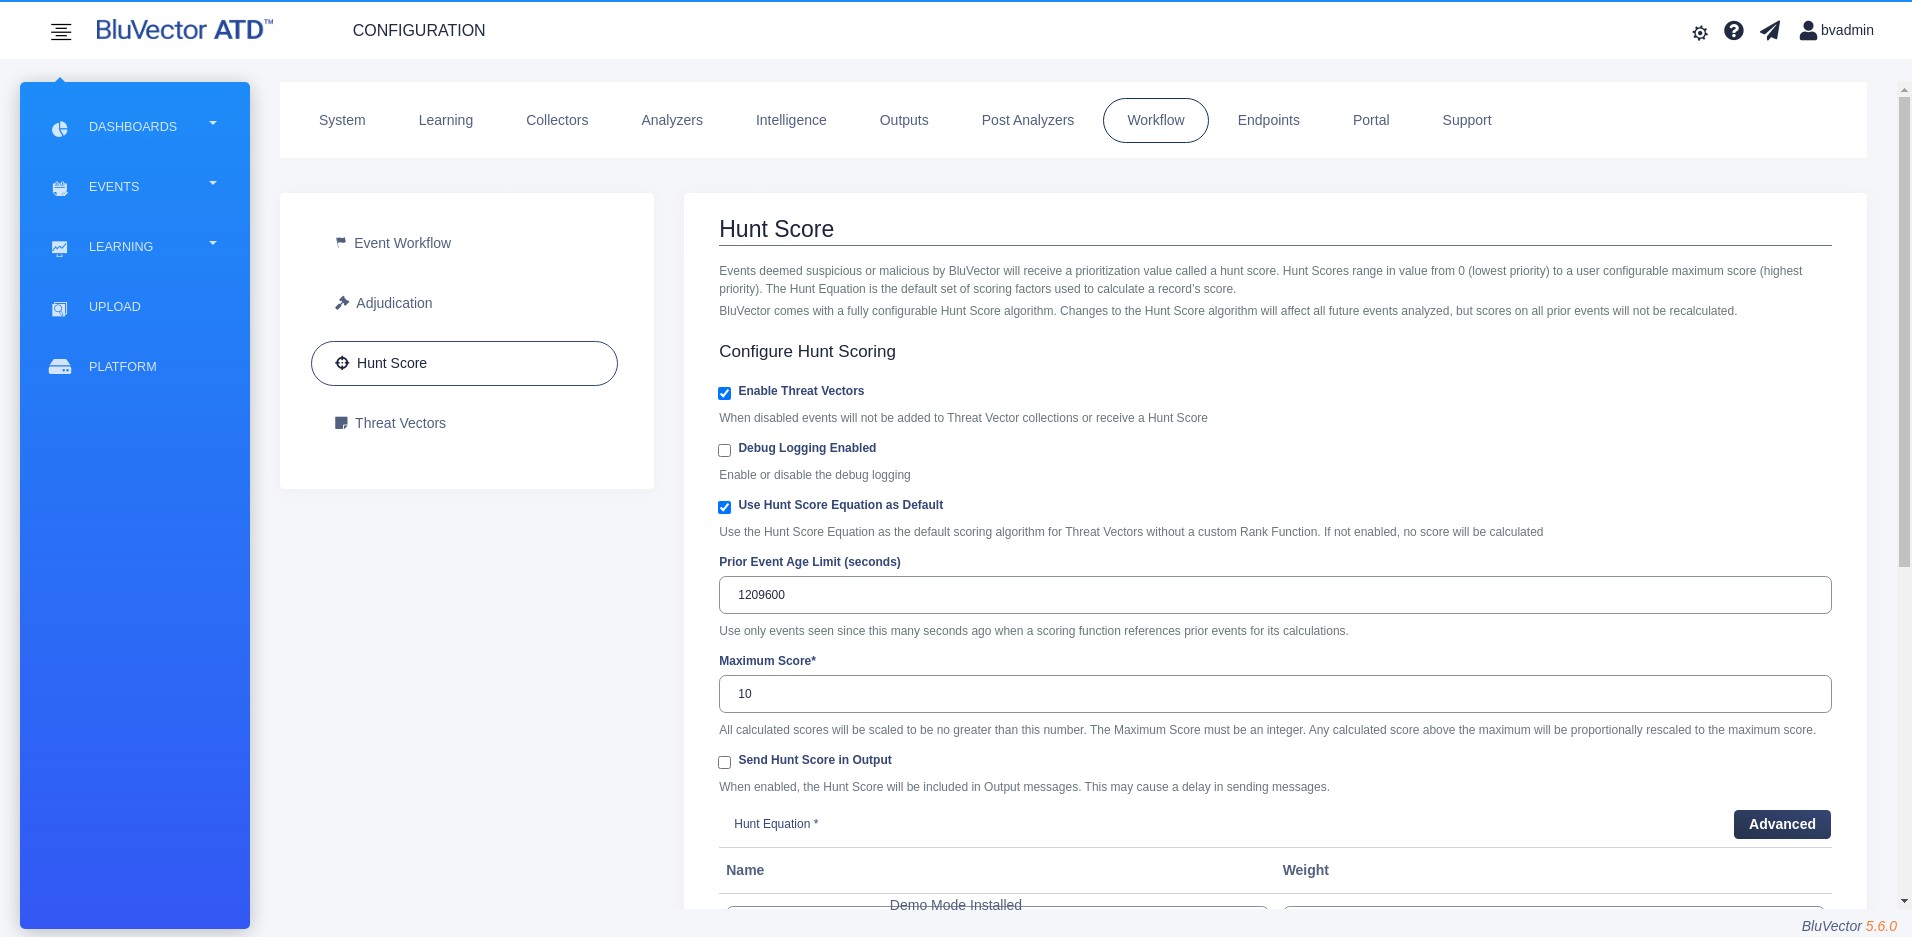
Fig. 106: Hunt Scoring Configuration Screen
Select Enable Threat Vectors to activate Hunt Scoring and Threat Vector collections. The Threat Vector collections feature must be active in order to use Hunt Scoring. Deselecting Enable Threat Vectors will turn off both Hunt Scoring and Threat Vector collections.
Select Use Hunt Score Equation as Default to allow the Hunt Equation to be used for scoring when any Threat Vector has no defined Scoring Factors.
Enter the Prior Event Age Limit in seconds. Events this much older than the event being scored will not be included when calculating scores.
Enter the Maximum Score. Scoring equations may produce raw scores over any range, but the score recorded in BluVector will be capped to this value. For example, if a scoring equation produced a raw score of 21, but the Maximum Score is set to 10, then that record would receive a score of 10.
Edit the Hunt Equation scoring factors. Each row in the table is an individual scoring factor. Weights are applied to each factor, and their weighted values are summed to arrive at a record’s score. Each factor is defined by an equation. To edit the Hunt Equation, select Advanced. More detailed fields appear. Values in Lower Limit and Upper Limit are applied to the Weight value to help ensure entering an acceptable value for Weight. For extensive help on how to construct a scoring factor equation, select Help. Also see Section: Using Scoring Factors for the Hunt Equation for more information about editing the scoring factors.
Select Stage Changes to apply and save the updated configuration.
Procedure: Restore Hunt Equation to Default
Follow these steps to return the Hunt Equation to default settings:
Navigate to the “Workflow Configuration” Screen (see Section: Configuring Workflows).
Select Hunt Score in the menu that appears on the left. The “Hunt Scoring Configuration” Screen appears (see Figure: Hunt Scoring Configuration Screen).
In the ‘Hunt Equation’ section, select Advanced.
Select Restore Defaults.
Using Scoring Factors for the Hunt Equation
This section provides additional details for configuring the functions in the Hunt Equation scoring factors (see Section: Configuring Hunt Scoring for configuration instructions).
You can use the functions below to formulate a portion of a scoring equation. Individual portions of the scoring equation are weighted and added together. Please keep in mind that:
[metafield]indicates a BluVector event metafield.Available metafields can be found by viewing an event’s raw JSON.
Metafield names should always be enclosed in double quotes(“).
Functions that operate over the entire event collection have configurable query windows.
All queries start from current time and go back by the configured query window time frame (Prior Event Age Limit).
Function Name | Description |
|---|---|
| Returns 1 if the metafield exists in the event, otherwise returns 0. |
| Returns the real-value of the metafield if it exists, otherwise returns 0. |
| Returns the number of entries in the metafield if it exists, otherwise returns 0. |
| Returns the number of occurrences of the value of the metafield among the events within the query window, or returns 0 if the field is not an attribute of the event. |
| Returns the proportion of events with at least one flagged file across events in the query window with the same value of the metafield. |
| Returns 1 if any substring in the list is in the string representation of the metafield, otherwise returns 0. Individual substrings may not contain brackets. Substring list of length greater than 1 must be enclosed in brackets and comma separated. Quotes will be ignored within substrings. |
| Returns 1 if the metafield evaluates to an IP address and that IP address is in one of the defined subnets expressed in CIDR notation, otherwise returns 0. |
In addition to the domain specific functions above, BluVector scoring equations also support standard arithmetic operations, including:
addition (+)
subtraction (-)
multiplication (*)
division (/)
exponentiation (^)
Other common mathematical and logical operations must be explicitly invoked using the following functions. Arguments for these functions may be static integers, floats, or any combination of other functions and arithmetic operations.
Function Name | Description |
|---|---|
| Returns the integer closest to but greater than or equal to arg. Arg must be convertible to a float. Arg may itself be a valid scoring equation. |
| Returns the integer closest to but less than or equal to arg. Arg must be convertible to a float. Arg may itself be a valid scoring equation. |
| Returns the integer closest to arg. Arg must be convertible to a float. Arg may itself be a valid scoring equation. |
| Returns the absolute value of arg. Arg must be convertible to a float. Arg may itself be a valid scoring equation. |
| Returns the larger of arg1 and arg2. Arg1 and arg2 must be convertible to floats. Arg1 or arg2 may be a valid scoring equation. |
| Returns the smaller of arg1 and arg2. Arg1 and arg2 must be convertible to floats. Arg1 or arg2 may be a valid scoring equation. |
| Returns the natural logarithm (log base e) of arg. Arg must be convertible to a float and be > 0. Arg may itself be a valid scoring equation. |
| Returns the log base 10 of arg. Arg must be convertible to a float and be > 0. Arg may itself be a valid scoring equation. |
| Returns 1 if arg1 > arg2, otherwise returns 0. Arg1 or arg2 may be a valid scoring equation. |
| Returns 1 if arg1 < arg2, otherwise returns 0. Arg1 or arg2 may be a valid scoring equation. |
| Returns 1 if arg1 >= arg2, otherwise returns 0. Arg1 or arg2 may be a valid scoring equation. |
| Returns 1 if arg1 <= arg2, otherwise returns 0. Arg1 or arg2 may be a valid scoring equation. |
| Returns 1 if arg1 equals arg2, otherwise returns 0. Arg1 or arg2 may be a valid scoring equation. |
| Returns 1 if arg1 does not equal arg2, otherwise returns 0. Arg1 or arg2 may be a valid scoring equation. |
| Returns 1 if arg1 >= arg2 and arg1 <= arg3, otherwise returns 0. All args may be a valid scoring equation. |
Here is an example scoring equation:
gte(valueOf("files.analysis.hector.result.confidence"), 0.5) + exists("intel.providers") + 0.5 * flagFreq("meta.host") + max(1 / count("meta.host"), 0.1)This example equally weights the Machine Learning Engine confidence levels above 0.5 and an intelligence provider IOC hit, then increases the score based on how often the same host has produced suspicious events in the past. Finally, it adds up to 1 additional point based on how rarely BluVector sees the host (and adds more for rarer hosts).
Configuring Threat Vectors
A Threat Vector is a category for collecting records (unique event/content pairs) to construct analytic workflows. Threat vectors help you to focus attention on particular detection mechanisms and event contexts. You may use these collections to coordinate analyst efforts and track progress.
The system comes preconfigured with these Threat Vectors:
Known Bad: Content that has been flagged by ClamAV.
Yara Hits: Content that has been flagged by a Yara rule.
Suspicious Web: Content (excluding PDFs) from web (HTTP) events with both a high Machine Learning Engine score and a high hUri score (from a suspicious hostname) but not flagged by ClamAV.
Suspicious Email: Content (excluding PDFs) from email (SMTP) events with a high Machine Learning Engine score but not flagged by ClamAV.
Suspicious PDFs: PDF content from any protocol with a high Machine Learning Engine score but not flagged by ClamAV.
Intel Only Hits: Events (which may or may not include associated file content) from any protocol flagged only by an intelligence provider.
Unmatched Suspicious Events: The default collection for records that do not match any other enabled Threat Vector.
Note:
Changing the configuration (particularly the Filter Query and Scoring Factors) of an existing Threat Vector will only affect new records.
You can configure the Threat Vectors by following the procedures in this section. First, navigate to the “Threat Vector Configuration” Screen to proceed, as follows:
Navigate to the “Workflow Configuration” Screen (see Section: Configuring Workflows).
Select Threat Vectors in the menu that appears on the left. The “Threat Vector Configuration” Screen appears (see Figure: Threat Vector Configuration Screen).
 Fig. 107: Threat Vector Configuration Screen
The Threat Vectors are listed in sections which can be expanded to show more details. Each Threat Vector is defined by the following fields. All fields are required, except where noted:
Threat Vector Name: Display name of the Threat Vector collection.
Threat Vector Group Association: Name of the group to which the Threat Vector belongs (optional). Threat Vectors with the same group association will be displayed and summarized together on the Overview Dashboard (see Figure: Overview Dashboard). This is not a required field.
Filter Query: A valid Routing Criteria. This query filter identifies which records will be included in the collection. For a list of available metadata to use in your query and PinPoint menus, see Section: Understanding Data Schemas.
Pinpoint Filters: A hierarchical set of metafields used to construct the PinPoint drill-down from the Threat Vector View (see Figure: Threat Vector View).
Scoring Factors: A mathematical combination of specially designed functions that operate over the record’s metadata fields to define a score for the record. The score is used to sort the records within the collection on the Threat Vector View (see Figure: Threat Vector View).
The following procedures describe how to add, edit, enable and disable, and remove a Threat Vector.
Procedure: Add a Threat Vector
Follow these steps to add a new Threat Vector:
Navigate to the “Threat Vector Configuration” Screen (see Figure: Threat Vector Configuration Screen).
Select Add New at the very bottom of the screen.
Fill out all required Threat Vector configuration fields.
Select Stage Changes. The system will validate the input on the form. If there is a problem with the changes, an error message will appear at the top of the screen. If the changes are acceptable, a green success message will appear at the top of the screen.
Procedure: Edit a Threat Vector
Follow these steps to edit an existing Threat Vector:
Navigate to the “Threat Vector Configuration” Screen (see Figure: Threat Vector Configuration Screen).
Find the Threat Vector you wish to edit. Select its dropdown arrow to display more details.
Make your desired changes to the Threat Vector definition.
Select Stage Changes. The system will validate the input on the form. If there is a problem with the changes, an error message will appear at the top of the screen. If the changes are acceptable, a green success message will appear at the top of the screen.
Procedure: Enable or Disable a Threat Vector
Follow these steps to enable or disable a threat vector:
Navigate to the “Threat Vector Configuration” Screen (see Figure: Threat Vector Configuration Screen).
Find the Threat Vector you wish to edit. Select its dropdown arrow to display more details.
Select Enabled to enable the Threat Vector. Deselect Enabled to disable it.
Select Stage Changes. The system will validate the input on the form. If there is a problem with the changes, an error message will appear at the top of the screen. If the changes are acceptable, a green success message will appear at the top of the screen.
Procedure: Remove a Threat Vector
Please note that the Unmatched Suspicious Event Threat Vector may not be removed. Follow these steps to remove a Threat Vector:
Navigate to the “Threat Vector Configuration” Screen (see Figure: Threat Vector Configuration Screen).
Find the Threat Vector you wish to edit. Select its dropdown arrow to display more details.
Select Delete for that Threat Vector to remove it from the system.
Select Stage Changes. The system will validate the input on the form. If there is a problem with the changes, an error message will appear at the top of the screen. If the changes are acceptable, a green success message will appear at the top of the screen.
Configuring Endpoints
You can configure BluVector Sensors to initiate response actions through integrations with third-party endpoint cyber security solutions and community standards. Most endpoint integrations work by updating hash block and ban lists. You can choose endpoints to configure from the “Endpoints Configuration” Screen. To bring up this screen:
Log in to the ATD GUI.
Select the sprocket icon at the top right.
Select Endpoints. The “Endpoints Configuration” Screen appears.
A menu of endpoint choices appears on the left.
The following sections provide procedures for configuring integrations and response actions through endpoints that include:
Symantec ICDx (see Section: Configuring Symantec ICDx)
Configuring Symantec ICDx
Symantec Integrated Cyber Defense Exchange (ICDx) is a software layer that bridges Symantec products and partner applications, such as BluVector. When configured, BluVector will forward events to ICDx for further action. You must configure your Symantec products to take action, based on the BluVector events sent to ICDx. You may configure multiple feeds, using different event criteria or accessing different ICDx hosts.
The following procedure describes how to configure this endpoint:
Procedure: Configure the Symantec ICDx Endpoint
Follow these steps to configure Symantec ICDx:
Navigate to the “Endpoints Configuration” Screen (see Section: Configuring Endpoints).
Select Symantec ICDx in the menu that appears on the left. The “Symantec ICDx Configuration” Screen appears (see Figure: Symantec ICDx Configuration Screen).
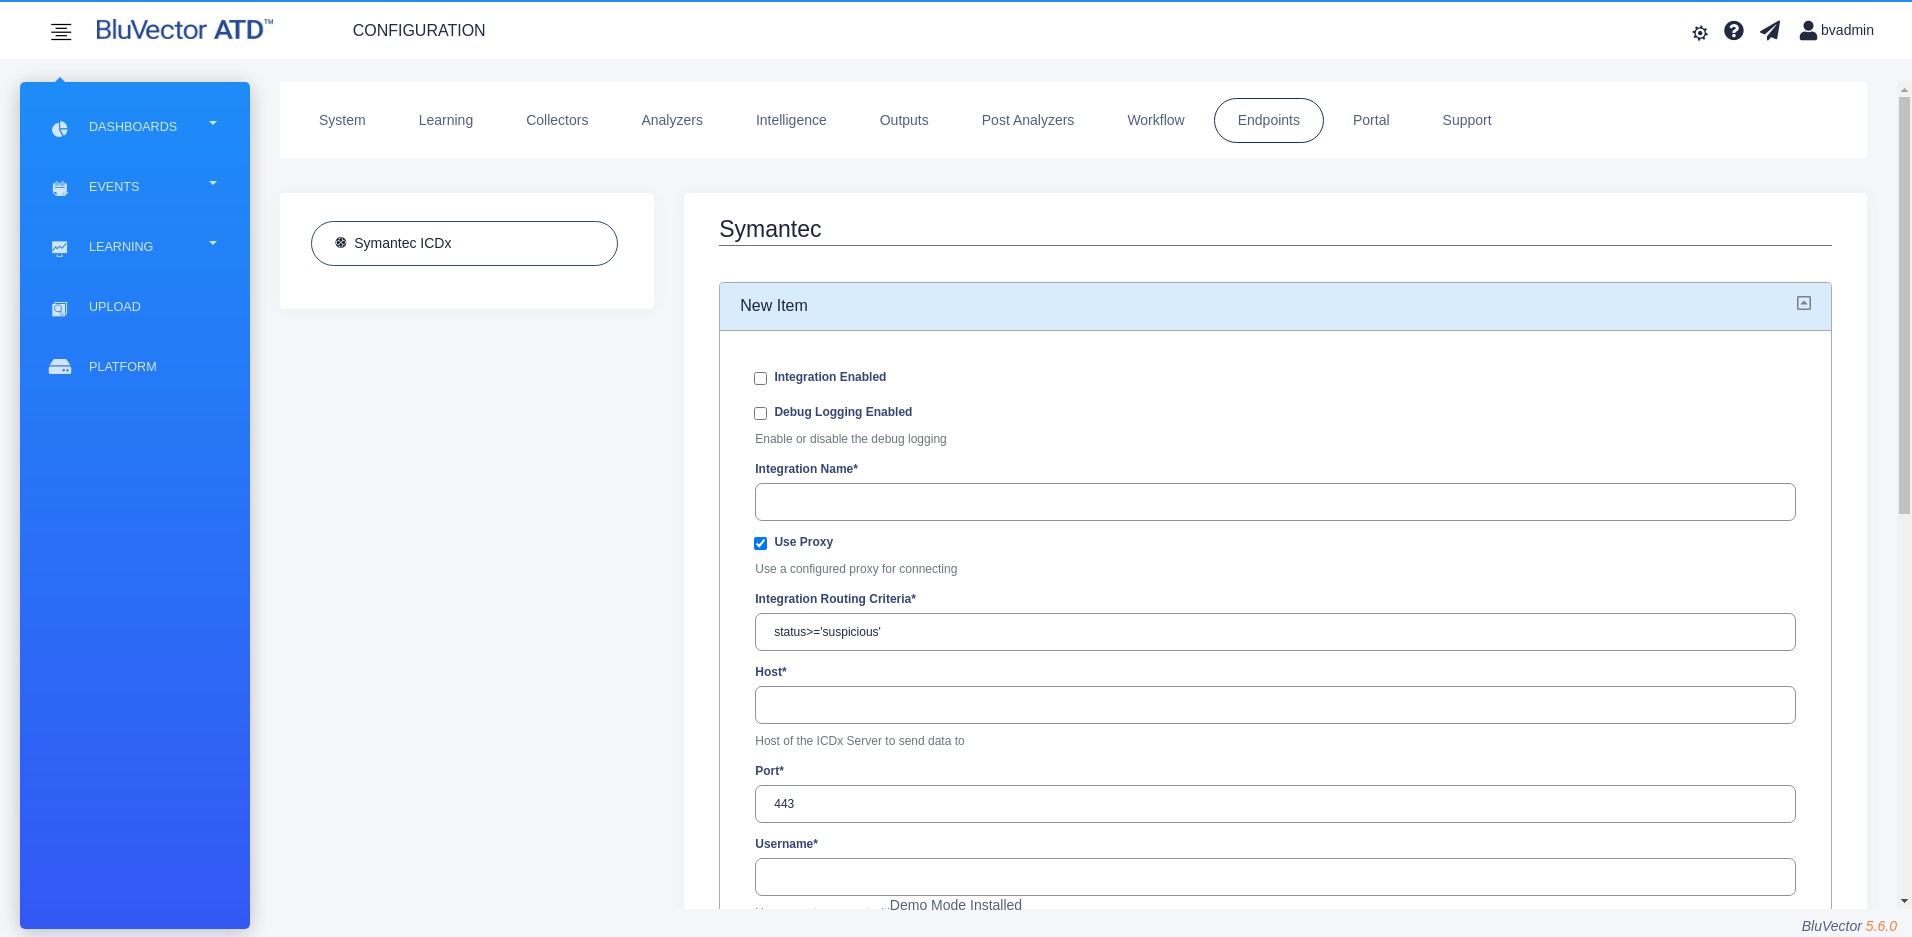
Fig. 108: Symantec ICDx Configuration Screen
Enter a desired name for the integration in ‘Integration Name’.
Enter the ‘Integration Routing Criteria’.
Enter the hostname of the ICDx server for ‘Host’.
Enter the port for ‘Port’.
Enter the appropriate ‘Username’ and ‘Password’ for the account on the ICDx server that is dedicated to BluVector.
Select Stage Changes to apply and save the updated configuration, or select Clear to return to the previous values.
Configuring BluVector Portal
BluVector Sensors can communicate with the BluVector global cloud infrastructure, known as the BluVector Portal. See Section: Using the BluVector Portal for more information about the BluVector Portal.
The following procedures describe how to configure the BluVector Portal for:
Analytic signature and file updates that get distributed
System telemetry that is collected
Procedure: Configure BluVector Portal Updates
Follow these steps to configure updates that the BluVector Portal distributes:
Log in to the ATD GUI.
Select the sprocket icon at the top right.
Select Portal. The “Portal Configuration” Screen appears.
Select Updates in the menu that appears on the left. The “BluVector Portal Update Configuration” Screen appears (see Figure: BluVector Portal Update Configuration Screen).
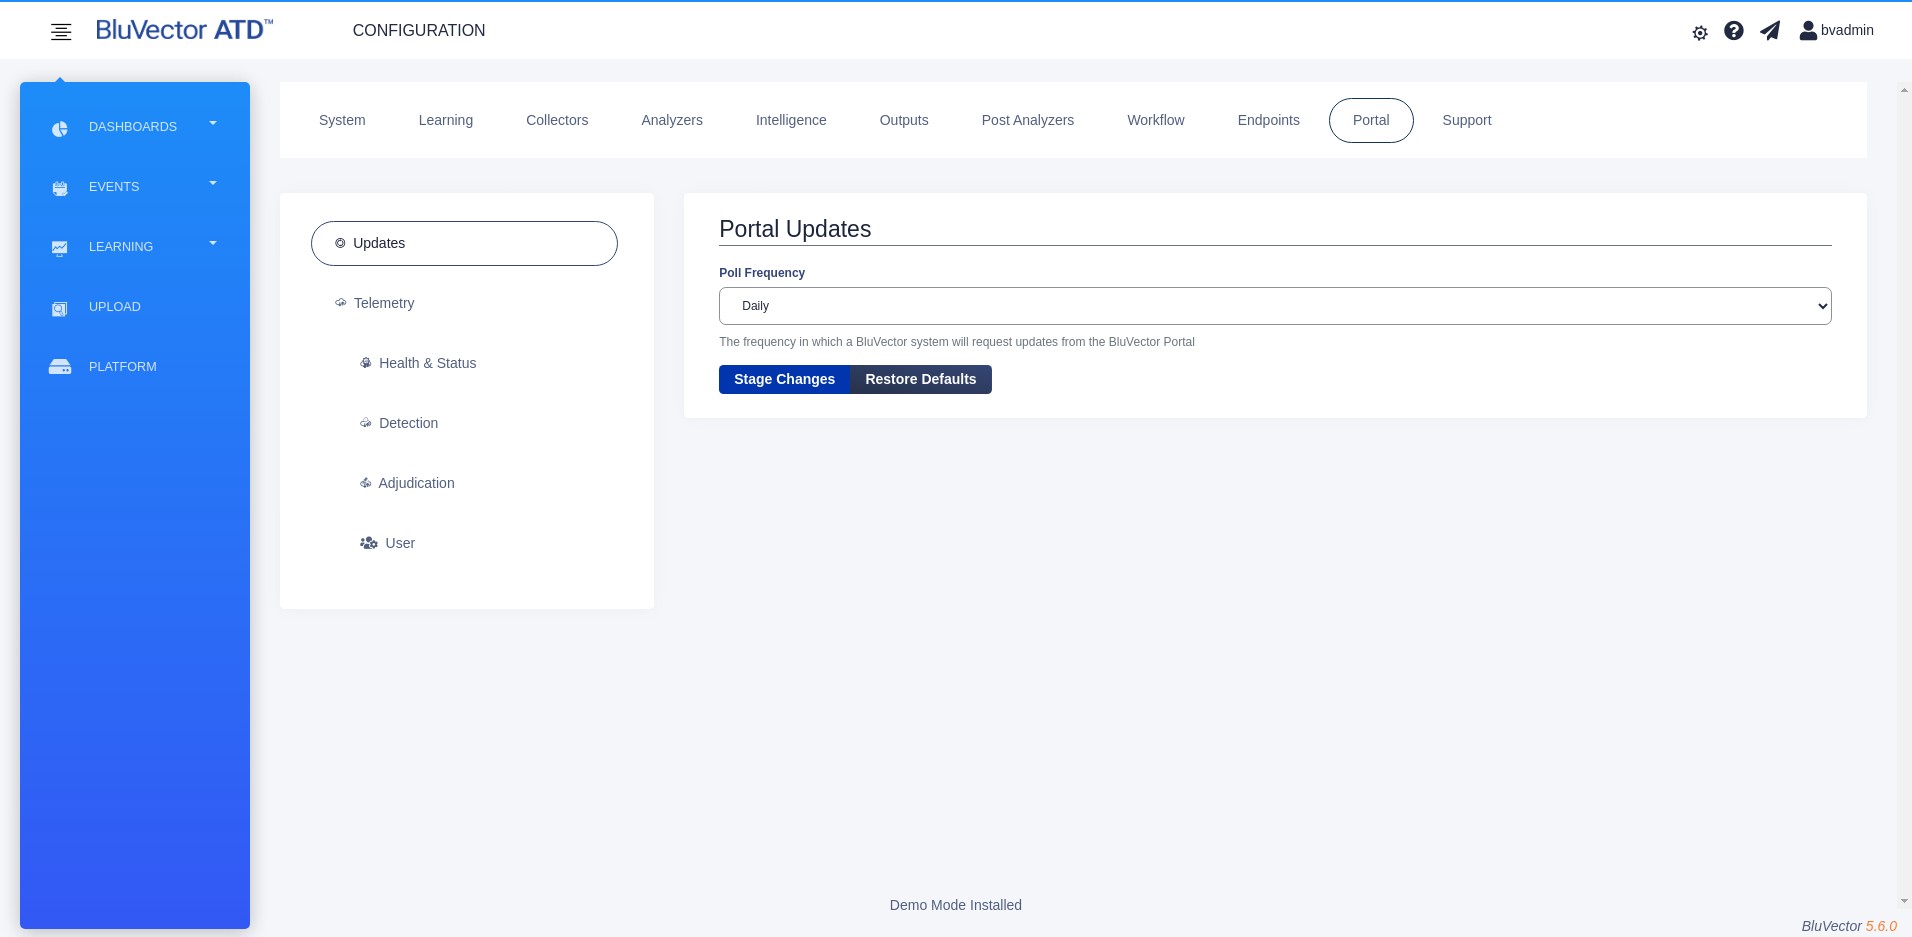
Fig. 109: BluVector Portal Update Configuration Screen
Select the desired update frequency for Poll Frequency. To disable updates from the BluVector Portal, select Off.
Select Stage Changes to apply and save the updated configuration, or select Clear to return to the previous values.
The BluVector Portal collects certain engineering data, referred to as telemetry. This telemetry helps improve future versions of the system. No event-specific metadata is included in the telemetry feed from a system to the portal. Participation in telemetry collection is optional and may be disabled at any time. There are three types of telemetry data:
Health & Status: Sends an update about whether the system components are working properly.
Detection: Sends information about suspicious events that were detected.
Adjudication: Sends notice when a user changes a status.
User: Sends information about use of various user interface features.
The procedure for configuring each telemetry type is similar. You can configure each type independently from the other types.
Procedure: Configure System Telemetry
Follow these steps to configure one of the system telemetry types that is collected for the BluVector Portal:
Log in to the ATD GUI.
Select the sprocket icon at the top right.
Select Portal. The “Portal Configuration” Screen appears.
Select one of the telemetry types from the menu that appears on the left. The “BluVector Portal Telemetry Configuration” Screen appears (see Figure: BluVector Portal Update Configuration Screen). The screen title will vary, depending on which type you have chosen.
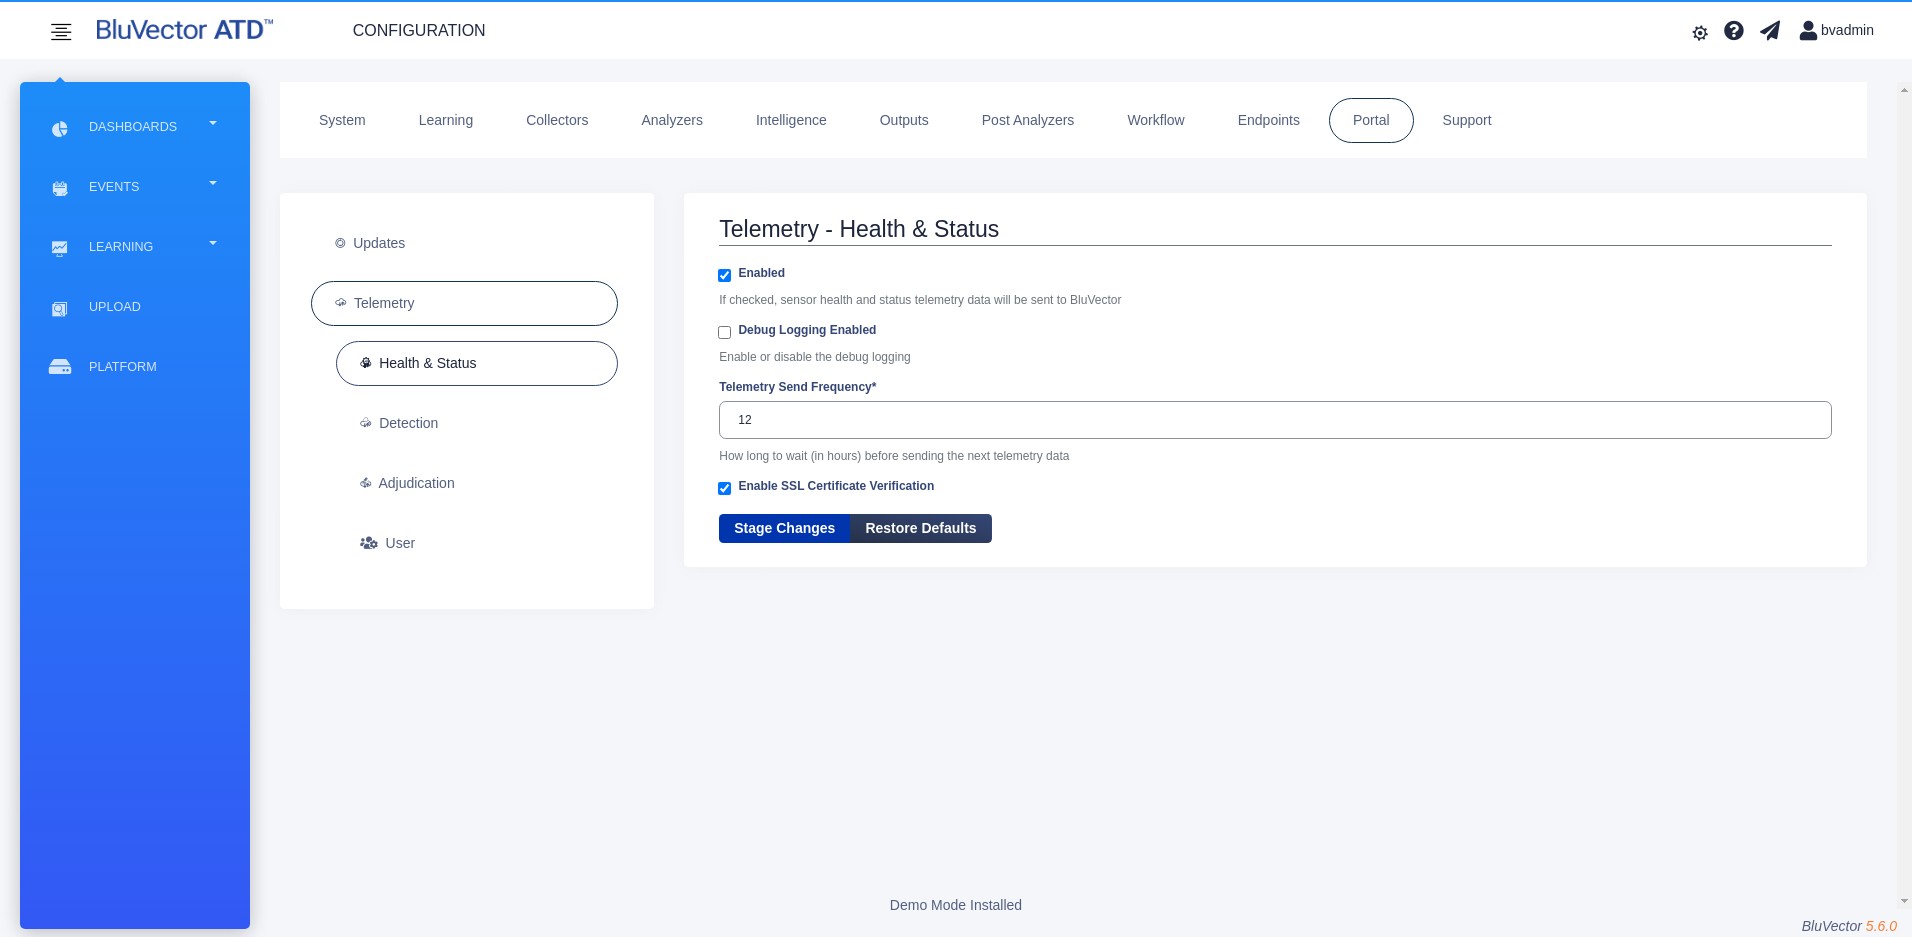
Fig. 110: BluVector Portal Telemetry Configuration Screen
To enable the telemetry feed, select Enabled. To disable telemetry, deselect Enabled.
Select the desired ‘Telemetry Send Frequency’.
If you are using SSL break-and-inspect technology with a self-signed certificate, you will need to deselect Enable SSL Certificate Verification.
Select Sending All Events to send all detection telemetry events. Deselect Sending All Events to exclude those that have no content, where there are no file fields and no analysis results.
Select Stage Changes to apply and save the updated configuration, or select Clear to return to the previous values.
Generating Support Bundles
This section describes how to request BluVector Customer Support for technical issues. Typically, when you have a technical problem, you will create a new support bundle. The support bundle will be submitted to Customer Support. You do not necessarily need to contact Customer Support first. After Customer Support reviews the support bundle, they will usually make an execution bundle that you can upload through the web interface to resolve any issues.
The following procedure describes how to generate a new support bundle.
Procedure: Generate a Support Bundle
Follow these steps to create a new support bundle for Customer Support:
Log in to the ATD GUI.
Select the sprocket icon at the top right.
Select Support. The “Support” Screen appears. (see Figure: Support Screen)
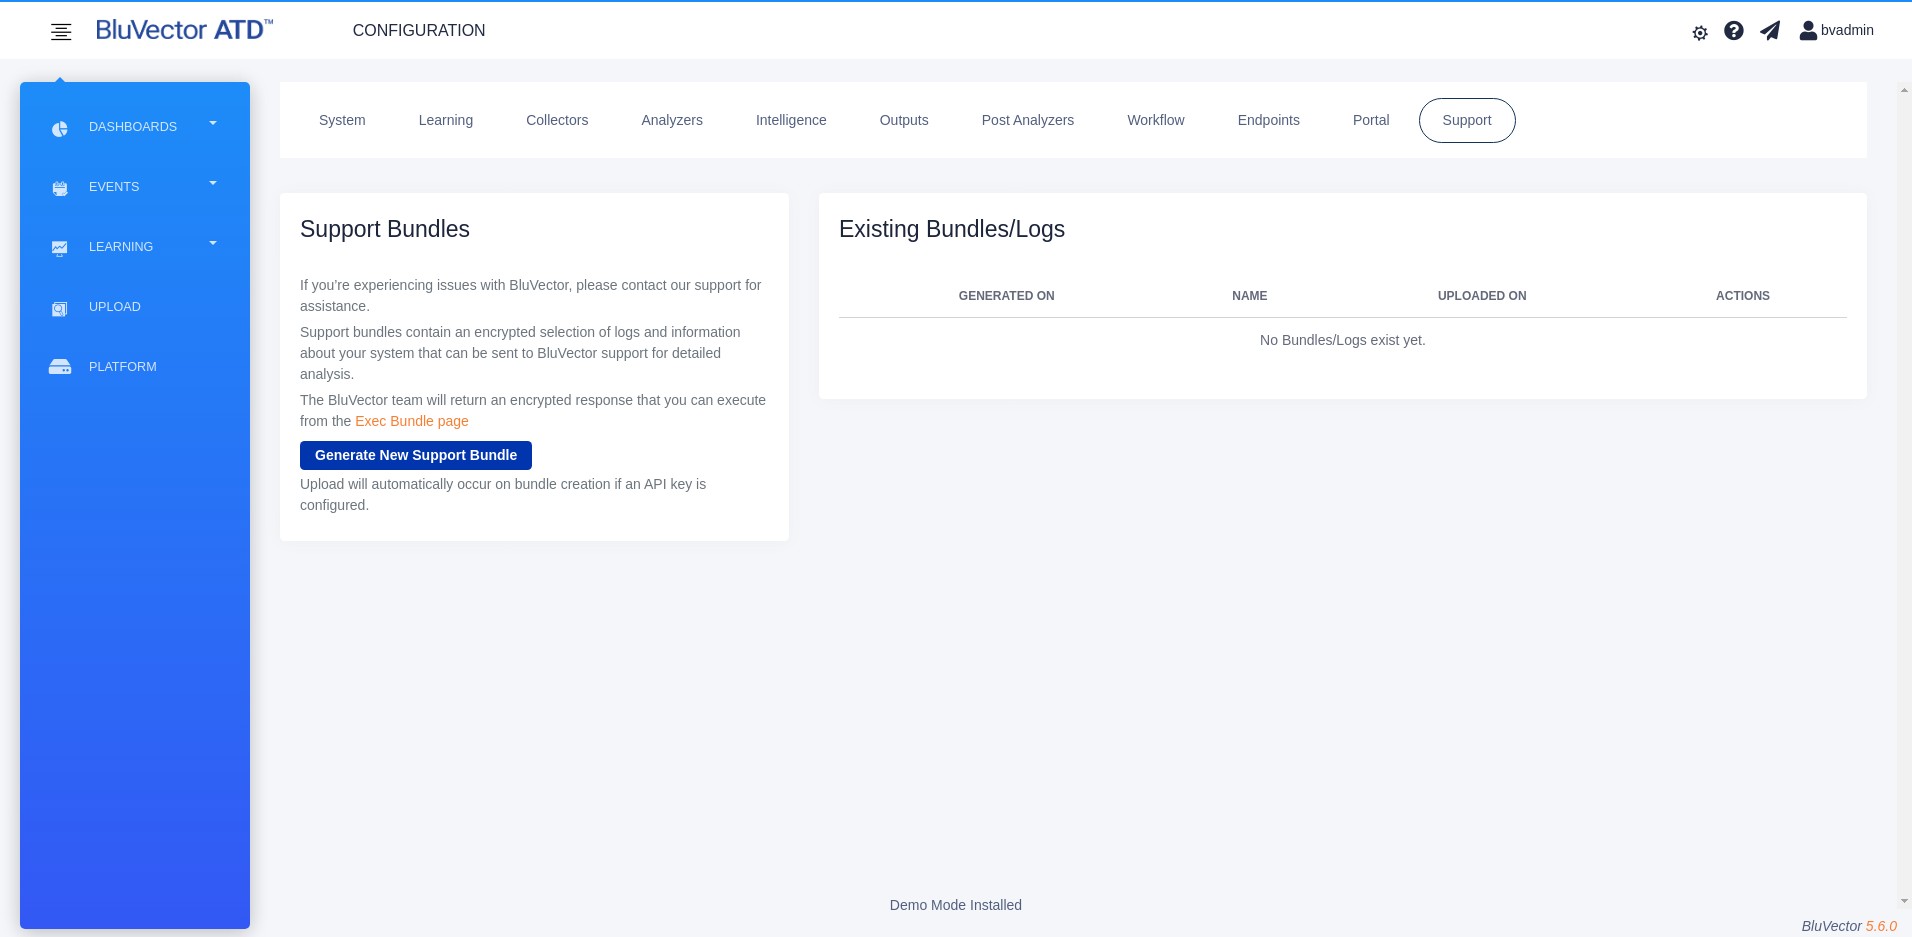
Fig. 111: Support Screen
Select Generate New Support Bundle. It will take a minute or so for the encrypted support bundle to be generated into a file named: SupportBundle-timestamp.tar.gz.aes
Select the option to upload the file directly to the BluVector Portal. If the file upload fails, then download the file to your desktop, or to any other location where you can easily find it.
Contact Customer Support for further instructions. See Section: Contacting Customer Support for more information.
If the system is configured with a BluVector Portal API Key, you may upload the bundle to the BluVector Portal, and it will automatically be submitted to the Customer Support team. Otherwise, use an alternative method provided by your Customer Support representative.
Configuring Connectors
Through its Connectors framework, BluVector allows you to quickly look up information from an event or file using external, third-party websites. Connectors create contextual requests to websites by dynamically constructing URLs based on either event or file metadata. The Connectors are available on the “Event Details” Screen (see Section: Using the Event Details Screen).
Requests made using Connectors are generated by your browser and do not flow through a BluVector appliance. You must have access permission on your local machine to reach the configured third-party websites. Connectors are configured to a specific individual user, but you can share the Connectors across all users on the system.
To configure Connectors, first bring up the “Connectors Configuration” Screen as follows:
From the ATD GUI, select your user name in the upper right corner. A menu appears.
Select Account.
Select Connectors. The “Connectors Configuration” Screen appears (see Figure: Connectors Configuration Screen).
 Fig. 112: Connectors Configuration Screen
The screen shows the existing Connectors. The following procedures describe how to create, edit, and delete a Connector. You can also hide connectors that were created by other users.
Procedure: Create or Edit a Connector
Follow these steps to add a new Connector or to edit an existing one:
Navigate to the “Connectors Configuration” Screen (see Figure: Connectors Configuration Screen).
Select a choice to either add or edit a Connector:
To add a new Connector, select Create New Connector. The “Create Connectors” Screen appears. This screen contains the same fields as the “Update Connectors” Screen (see Figure: Update Connectors Screen).
To edit an existing Connector, select Edit on the row for the Connector you wish to change. The “Update Connectors” Screen appears (see Figure: Update Connectors Screen).
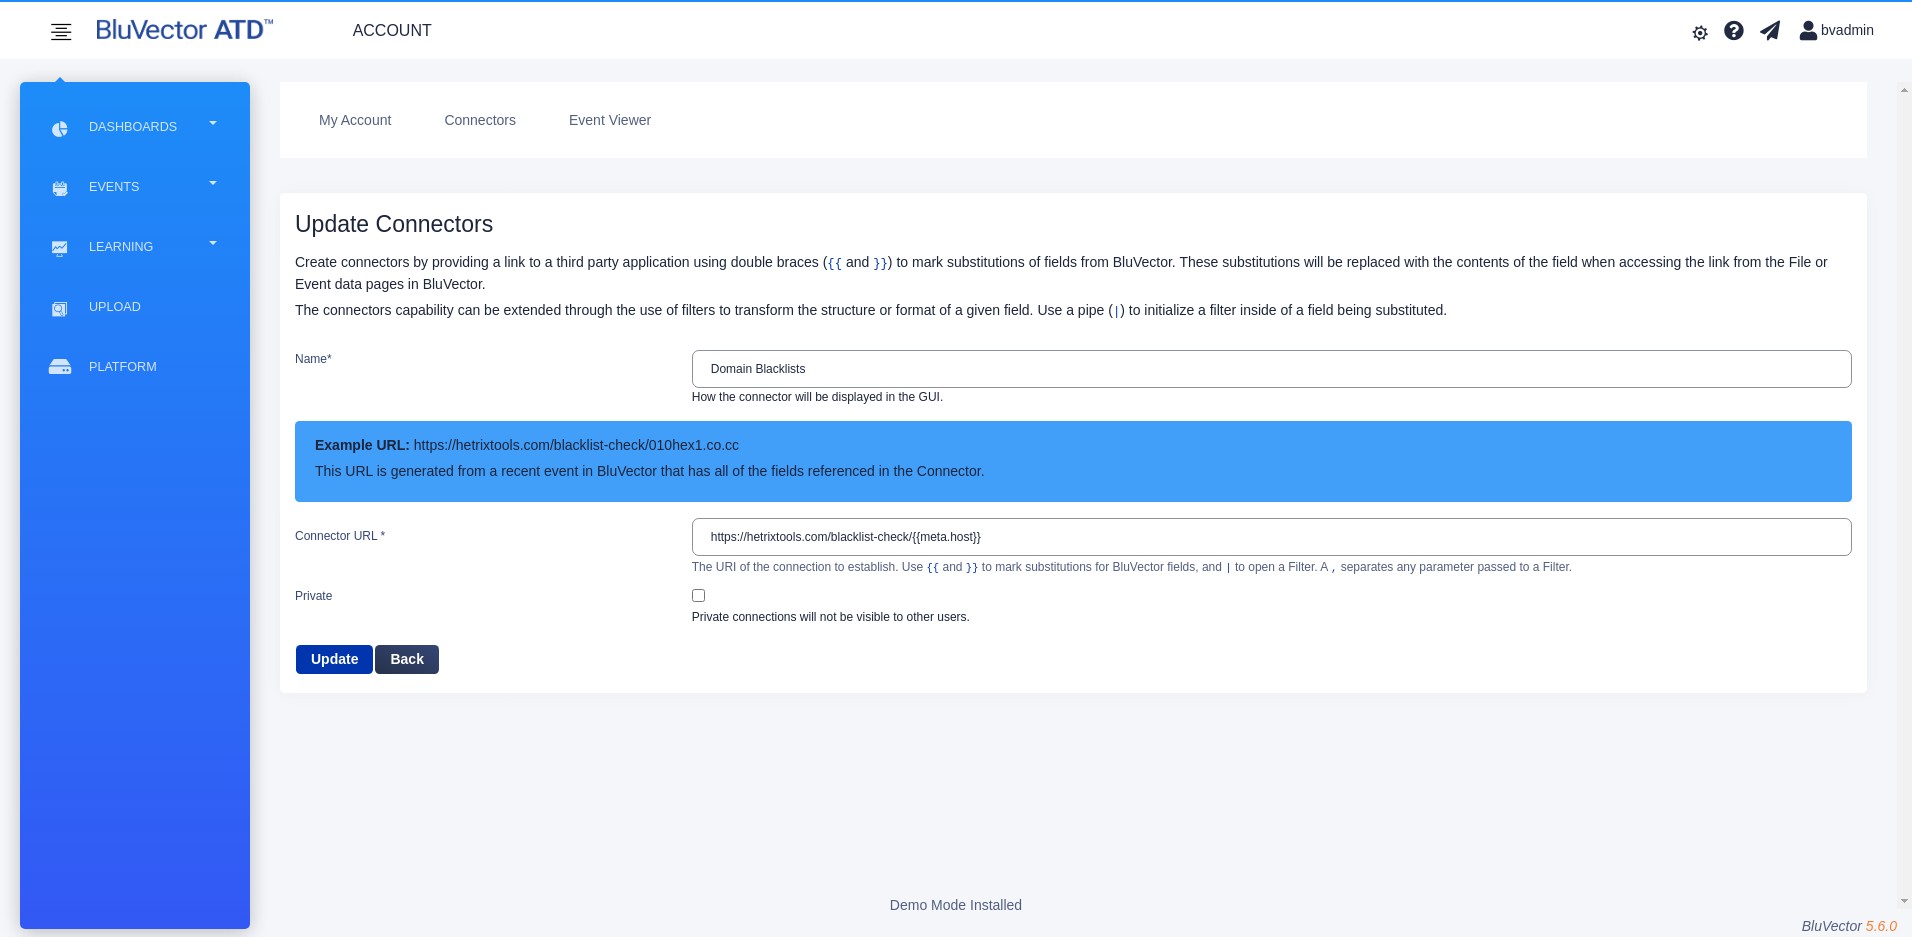
Fig. 113: Update Connectors Screen
Enter a ‘Name’ for the Connector.
Enter a ‘Connector URL’. This field may contain event or file metadata fields that will be dynamically replaced when using this Connector on a particular event. For example:
If the ‘Connector URL’ is
https://www.google.com/search?q={{meta.host}},And the hostname associated with the event where the Connector is used is
badguy.com,Then selecting the Connector from the Event Details Screen will open a new browser tab with a Google search for badguy.com.
Select the option to finish adding or creating the Connector (select Create or Update).
Procedure: Delete a Connector
Follow these steps to delete a Connector:
Navigate to the “Connectors Configuration” Screen (see Figure: Connectors Configuration Screen).
Select Delete on the row for the Connector you want to remove.
Confirm the action by selecting Delete in the confirmation window.
Procedure: Hide Connectors Created by Other Users
Follow these steps to hide Connectors that were created by other users:
Navigate to the “Connectors Configuration” Screen (see Figure: Connectors Configuration Screen).
On the right side, the section Connectors Created by Other Users will list the Connectors that other users created, along with available actions to take.
Hiding these connectors prevents them from appearing on the events or files that you view. It affects only your account.
Configuring the BluVector ATD Host
The BluVector System runs on the BluVector ATD Host. The platform supports managing the BluVector server independently from the BluVector software applications. You can manage the server through the Cockpit interface. You can perform these configurations through Cockpit:
Managing signed certificates, licensing, and CSRs
Configuring IP Address and Domain
Updating and restarting the system
Configuring local user accounts, remote LDAP accounts, and remote NTP
Processing Exec Bundles
Backing up and restoring the system
Setting system HTTP/HTTPS proxies
Accessing a web shell terminal
Enabling two-factor authentication
Joining and unjoining sensors (only available on the ATD Central Manager)
The following sections provide details on logging into Cockpit, configuring the server level functions, as well as joining and unjoining BluVector Sensors. See these sections for more details:
Section: Logging into BluVector ATD Host
Section: Configuring IP Address and Hostname
Section: Performing System Upgrades
Section: Configuring User Accounts
Section: Configuring Remote NTP
Section: Processing Exec Bundles
Section: Backing Up and Restoring the System
Section: Configuring System Proxies
Section: Joining BluVector Sensors to the ATD Central Manager
Logging into BluVector ATD Host
Cockpit is the web-based management framework for BluVector ATD Host. To configure the server level functions, first log into Cockpit. There are multiple ways to log in:
From a browser
From the ATD GUI, by selecting Platform in the menu on the left
Through a command-line interface, using a standard SSH client The following procedure describes how to log in from a browser.
Log into Cockpit
Follow these steps to log into Cockpit:
From your browser, go to
https://HOSTNAME:9090, where HOSTNAME is the name or IP Address of the BluVector ATD Host instance. Upon initial connection, your browser will warn against connecting to an untrusted site.Accept the connection, and optionally save the certificate as a trusted site. The “BluVector ATD Host Login Screen” appears (see Figure: BluVector ATD Host Login Screen).
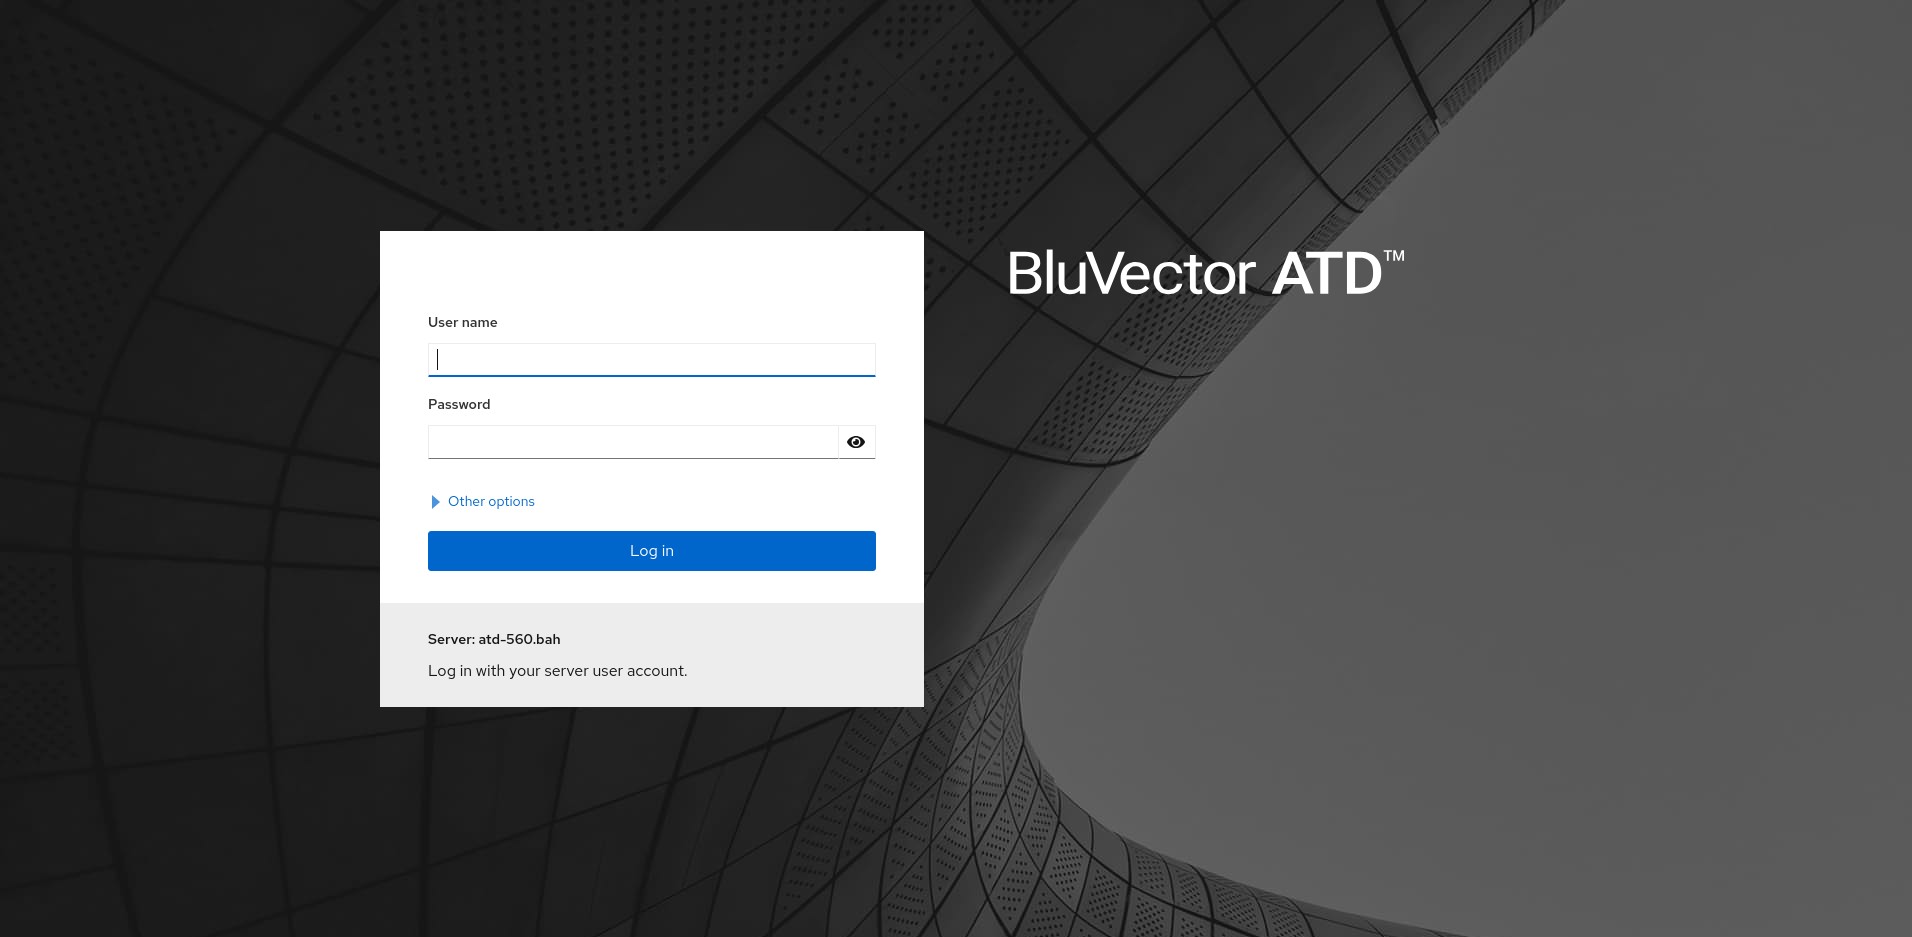
Fig. 114: BluVector ATD Host Login Screen
For the first time logging in:
Use the bvadmin account and password provided by BluVector. Alternatively, for a BluVector Virtual Machine, use the root account that you set during the creation of the BluVector Virtual Machine.
Select Log In. The “Cockpit System Overview for BluVector ATD Host” appears (see Figure: Cockpit System Overview for BluVector ATD Host).
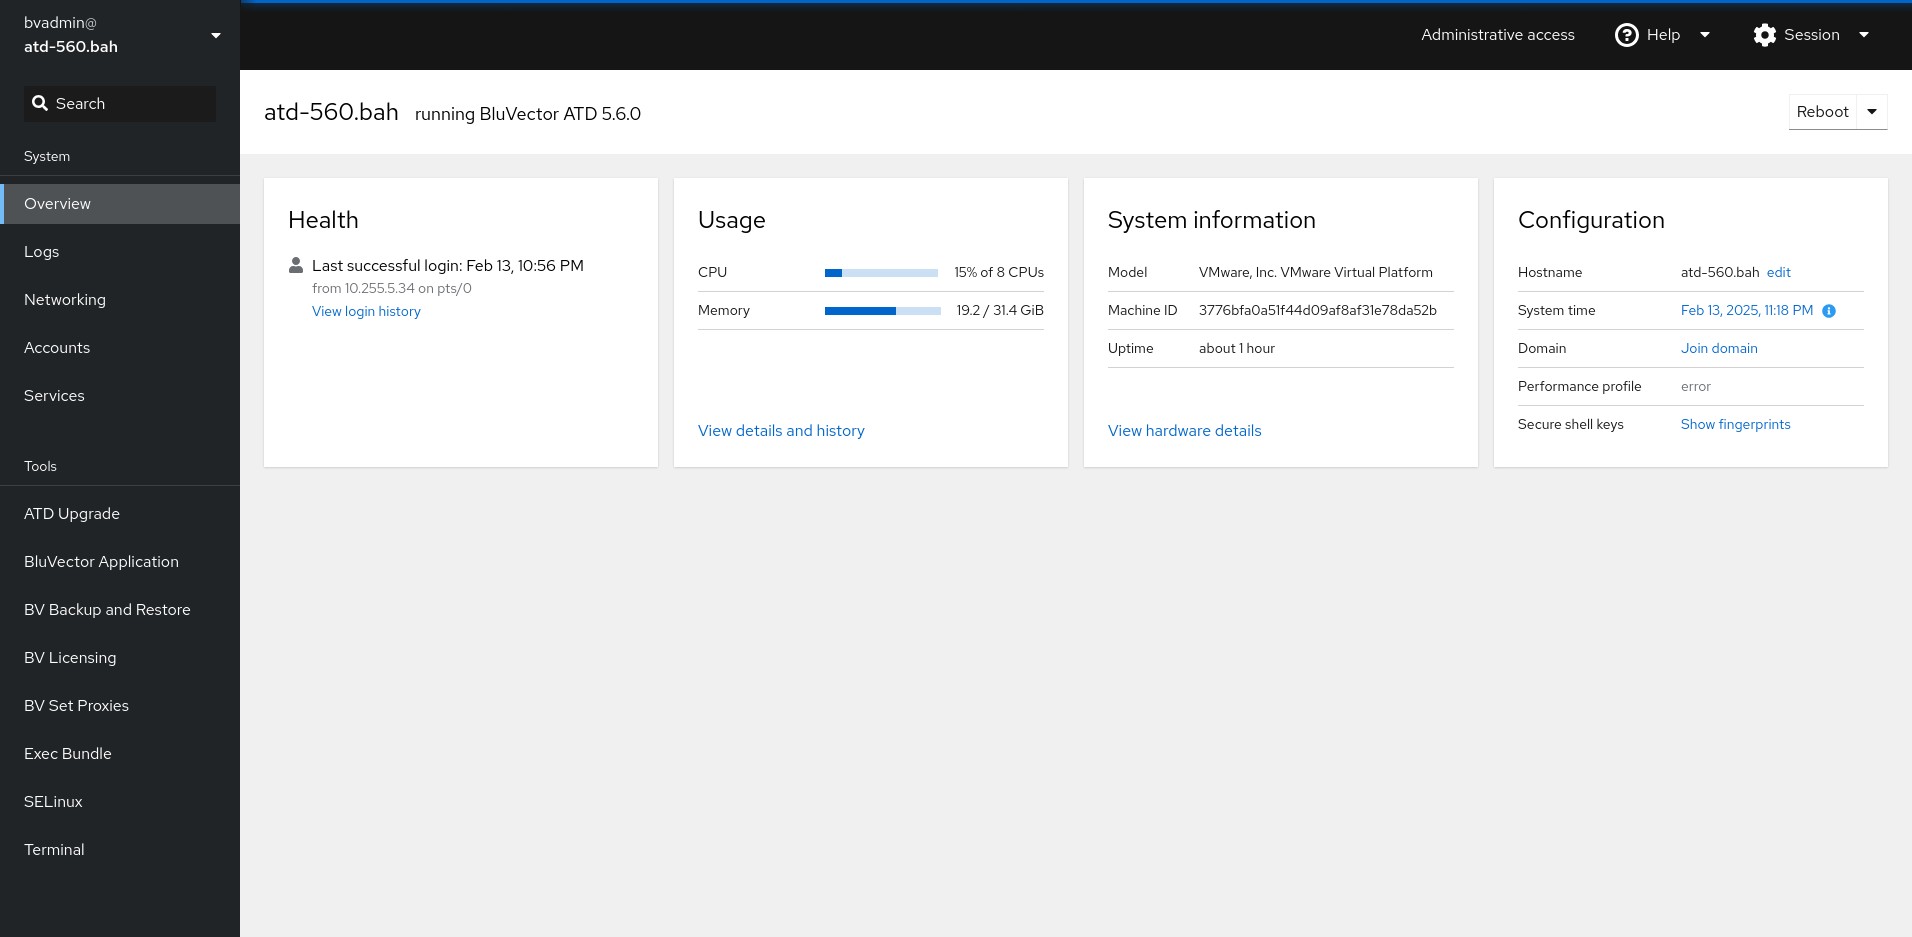
Fig. 115: Cockpit System Overview for BluVector ATD Host
Using a Signed Certificate for Cockpit
Cockpit automatically generates a self-signed certificate to encrypt web traffic over HTTPS. If you wish to use a signed certificate instead, follow the procedure below. For more information on using signed certificates within Cockpit, see https://cockpit-project.org/guide/latest/https.html.
Note:
Cockpit and the ATD GUI use different certificates. Using a signed certificate on one does not require or enable using a signed certificate on the other.
Cockpit loads a certificate from the /etc/cockpit/ws-certs.d directory. It uses the last file with a .cert extension, in alphabetical order. The .cert file requires the following:
It should contain at least two OpenSSL style PEM blocks.
The first one or more BEGIN CERTIFICATE blocks are used for the server certificate and the intermediate certificate authorities.
The last one should contain a BEGIN PRIVATE KEY, or similar entry.
The key may not be encrypted.
Procedure: Installing a Signed Certificate for Cockpit
Generate a valid .cert file (see Figure: Example Certificate File for an example). Name your .cert file beginning with a number and ending in a .cert extension. For example:
1-my-certificate.cert.Listing 5: Example Certificate File
-----BEGIN CERTIFICATE-----
MIIDUzCCAjugAwIBAgIJAPXW+CuNYS6QMA0GCSqGSIb3DQEBCwUAMD8xKTAnBgNV
BAoMIGI0OGE2NGNkNmMwNTQ1YThhZTgxOTEzZDE5YmJjMmRjMRIwEAYDVQQDDAls
...
-----END CERTIFICATE-----
-----BEGIN CERTIFICATE-----
MIIDUzCCAjugAwIBAgIJAPXW+CuNYS6QMA0GCSqGSIb3DQEBCwUAMD8xKTAnBgNV
BAoMIGI0OGE2NGNkNmMwNTQ1YThhZTgxOTEzZDE5YmJjMmRjMRIwEAYDVQQDDAls
...
-----END CERTIFICATE-----
-----BEGIN PRIVATE KEY-----
MIIEvgIBADANBgkqhkiG9w0BAQEFAASCBKgwggSkAgEAAoIBAQCyOJ5garOYw0sm
8TBCDSqQ/H1awGMzDYdB11xuHHsxYS2VepPMzMzryHR137I4dGFLhvdTvJUH8lUS
...
-----END PRIVATE KEY-----
SSH into the BluVector ATD Host, or use the terminal.
Copy your .cert file to the
/etc/cockpit/ws-certs.ddirectory.Restart Cockpit:
systemctl restart cockpitAlternatively, you may use certmonger to manage your signed certificate. Run the following commands:
CERT_FILE=/etc/pki/tls/certs/$(hostname).pem
KEY_FILE=/etc/pki/tls/private/$(hostname).key
getcert request -f ${CERT_FILE} -k ${KEY_FILE} -D $(hostname --fqdn)
-C "sed -n w/etc/cockpit/ws-certs.d/50-from-certmonger.cert
${CERT_FILE} ${KEY_FILE}"
Viewing and Uploading System License and CSR
A license file cryptographically secures that your BluVector System is authorized to operate. It is different from certificates used by web servers to encrypt web communications. You must have a license file in order to process network traffic through BluVector and to upgrade BluVector software. New BluVector hardware appliances will have an initial license file installed during manufacturing. Licenses for BluVector Virtual Machines must be requested.
The following procedure describes how to view, obtain, and install a license file.
Procedure: View, Obtain, and Install a License File
Follow these steps to view, obtain, and install a license file:
Log into Cockpit using an administrator account (see Section: Logging into BluVector ATD Host).
Select BV Licensing. The “System License and Certificate Signing Request” Screen appears (see Figure: System License and Certificate Signing Request Screen). You can view your current license file and your certificate signing request (CSR).
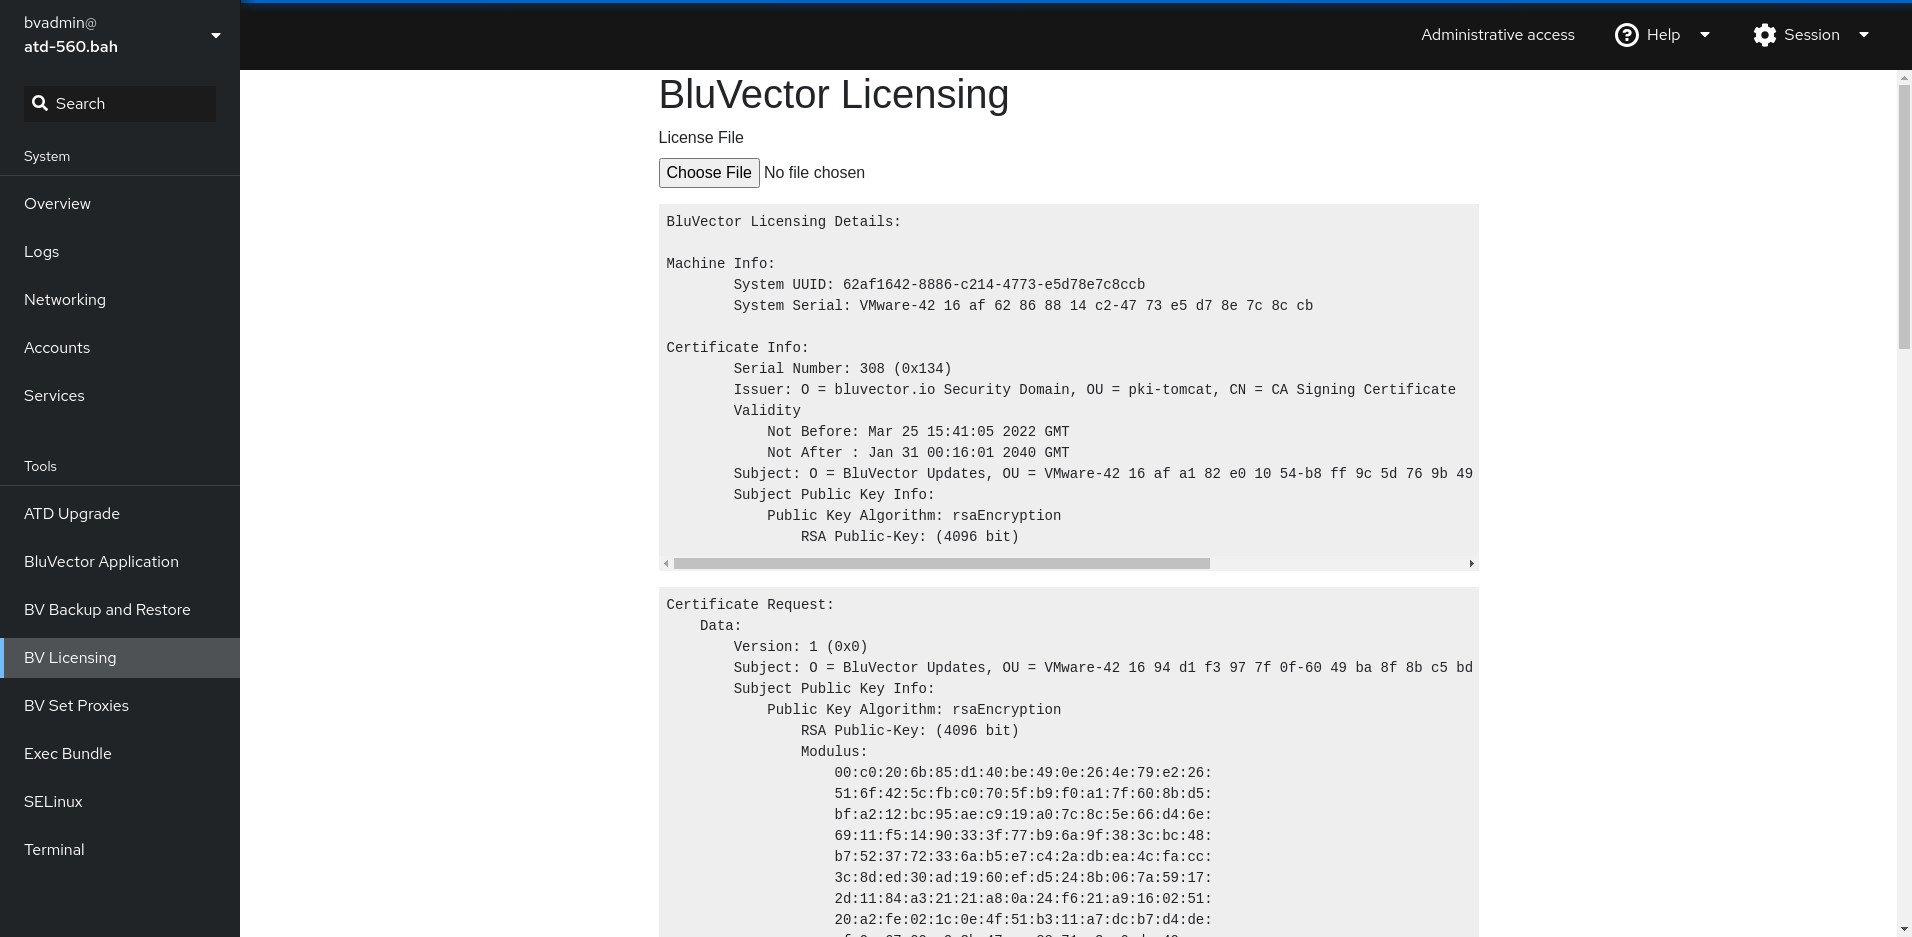
Fig. 116: System License and Certificate Signing Request Screen
Copy the CSR (everything below Certificate Request:) and email it to BluVector Customer Support (see Section: Contacting Customer Support).
BluVector Customer Support will send you a new BluVector signed license file.
Transfer the new license file to
/home/bvadmin/<license>, where<license>is the filename of the license file you received.Use one of these methods to install the license file:
Method #1: Select Choose File to select and install the license file.
Method #2: Run
/usr/sbin/install-licensing /home/bvadmin/<license>. You may SSH into BluVector or use the web terminal available in Cockpit.
Configuring IP Address and Hostname
You can configure the network interface used to communicate with BluVector ATD Host. Typically, a machine will use eth0 as its main interface. However, your hardware may differ. You can change the IP address and hostname for BluVector through the Cockpit interface. The following procedures explain how to make these changes.
Procedure: Change the IP Address
Follow these steps to change the IP address:
Log into Cockpit (see Section: Logging into BluVector ATD Host).
Select Networking. The “Networking” Screen appears.
Select the interface name to adjust the details. The networking options, including DHCP and DNS, are available. (See Figure: Change IP Address Screen.)
You will be prompted for confirmation before the changes are applied.
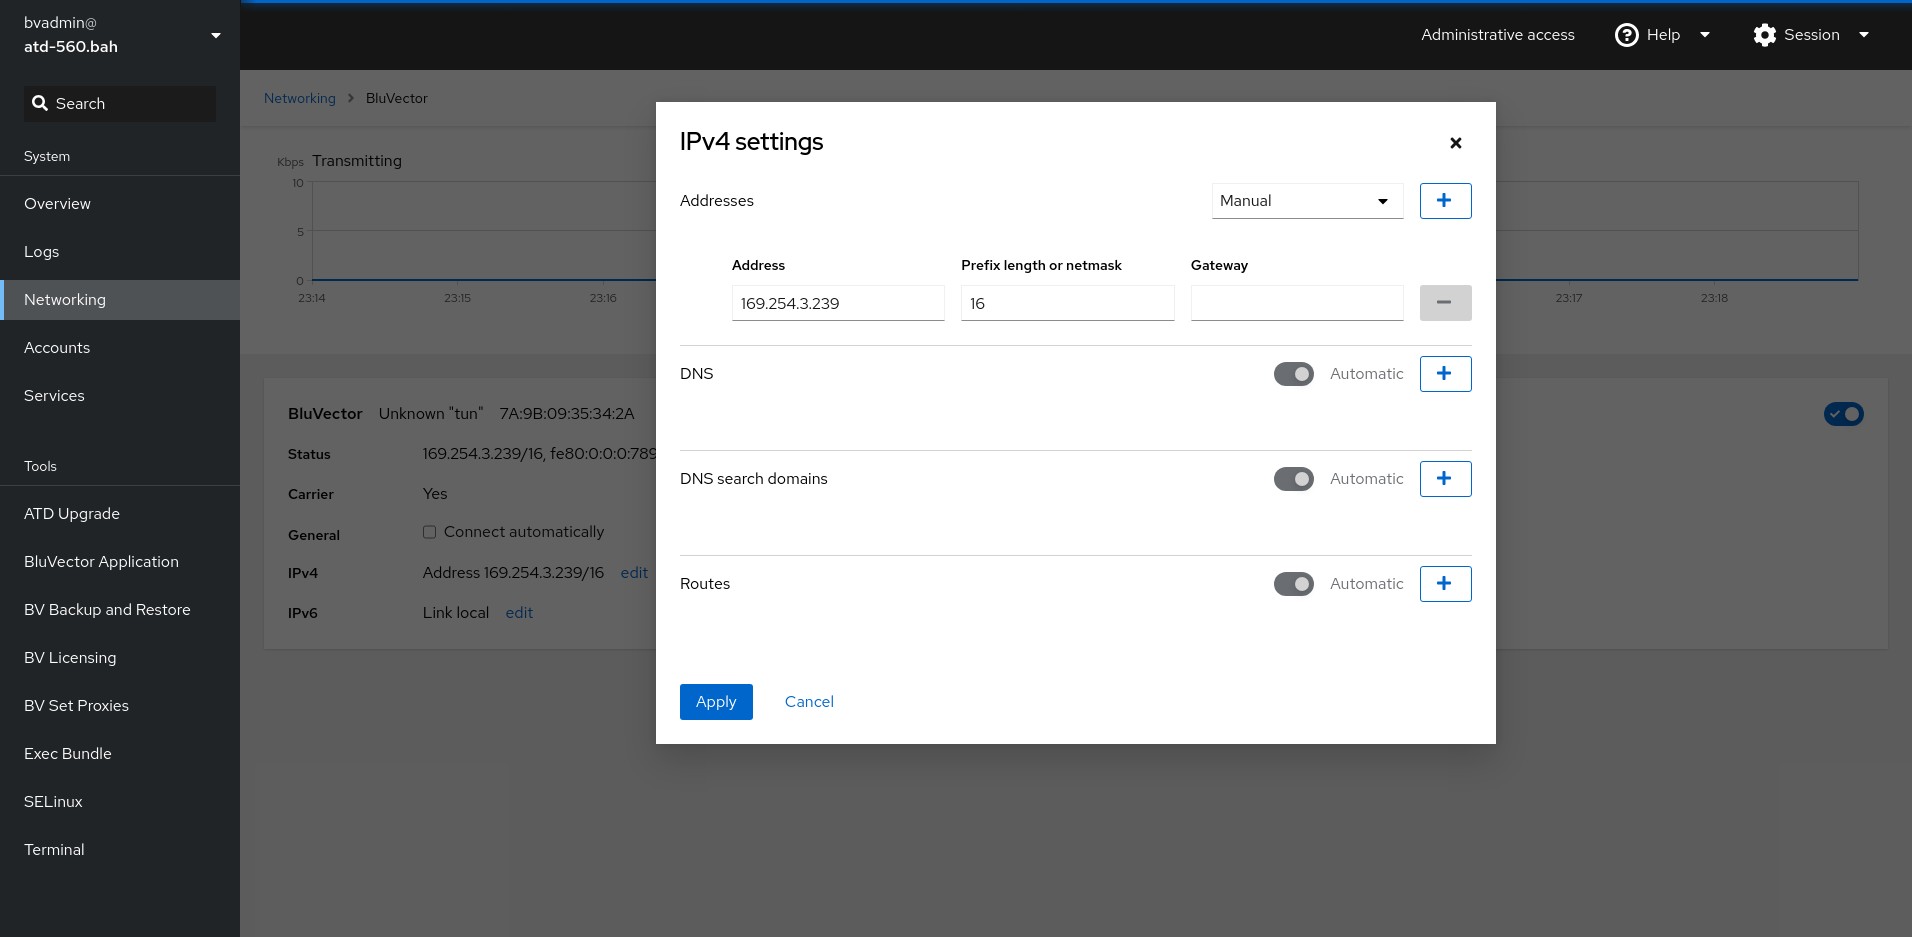
Fig. 117: Change IP Address Screen
You can change the machine’s hostname. For example, before joining an Active Directory Domain, the hostname should be set to reflect the name as it should appear in the forest. The following procedure describes how to change the hostname.
Procedure: Change the Hostname
Follow these steps to change the hostname:
Log in to Cockpit (see Section: Logging into BluVector ATD Host).
Select Overview. The “Cockpit System Overview” Screen appears.
Click the edit button next to the existing hostname in the Configuration tile, make the change, and confirm your modification.
Setting a Timeout and Banner for Cockpit
Cockpit allows any admin user to set an idle timeout in addition to a welcome banner. This configuration applies only to Cockpit. The ATD GUI timeout and welcome banner are configured separately as described in Section: Managing the System Settings.
The default idle timeout is 15 minutes. If no user behavior is observed for the duration of the idle timeout, then the user will be automatically logged out of Cockpit. By default, there is no banner until you configure one. The settings are configured in the file that is located at /etc/cockpit/cockpit.conf on the host system. (For more details about this file, see the Session section described at https://cockpit-project.org/guide/latest/cockpit. conf.5.html.) The following procedure describes how to set the timeout and welcome banner in Cockpit.
Procedure: Set a Timeout and Welcome Banner for Cockpit
Follow these steps to set the timeout and welcome banner for Cockpit:
Edit the file
/etc/cockpit/cockpit.confon the host system.Locate the
Sessionsection of the file.To set the idle timeout, add or edit the value in minutes for
IdleTimeout. Cockpit will automatically log out any user who is idle for more than this number of minutes. If you wish to disable the timeout completely, enterIdleTimeout=0. For example, to set the timeout to 10 minutes:[Session] IdleTimeout=10To configure a welcome banner, add or edit the value for Banner to be the path to a file that contains text to display on the login page. The file containing the banner text must be located in the
/etc/cockpit/directory. For example, to display “Welcome to BluVector!”, you can create a file named/etc/cockpit/ issuethat contains that text and then configure the following setting:[Session] Banner=/etc/cockpit/issue
Performing System Upgrades
Upgrades to BluVector appliances are delivered through online downloads of new software packages from the preconfigured repository. Customer Support and Customer Success teams will contact you when new system upgrades are available. Upgrades to the system are atomic, meaning that the entire upgrade occurs in a single step. Once the upgrade of the platform completes, the system will automatically restart the BluVector system containers. The upgrade is not complete until all containers are reporting as running.
Note:
When updating a BluVector Grid with an ATD Central Manager, the ATD Central Manager should be updated first, followed by the individual BluVector Collectors.
The following sections explain how to perform upgrades according to whether you have access to the Internet or are operating without an Internet connection:
If you need assistance with upgrades, please contact Customer Support (see Section: Contacting Customer Support).
Upgrading the System With an Internet Connection
The following procedure describes how to upgrade BluVector when you have an Internet connection.
Procedure: Upgrade BluVector With Internet Connection
Follow these steps to upgrade BluVector when you have connectivity to the Internet:
Log into Cockpit using an administrator account (see Section: Logging into BluVector ATD Host).
Select ATD Upgrade. The “Upgrade ATD” Screen appears (see Figure: Upgrade ATD Screen).
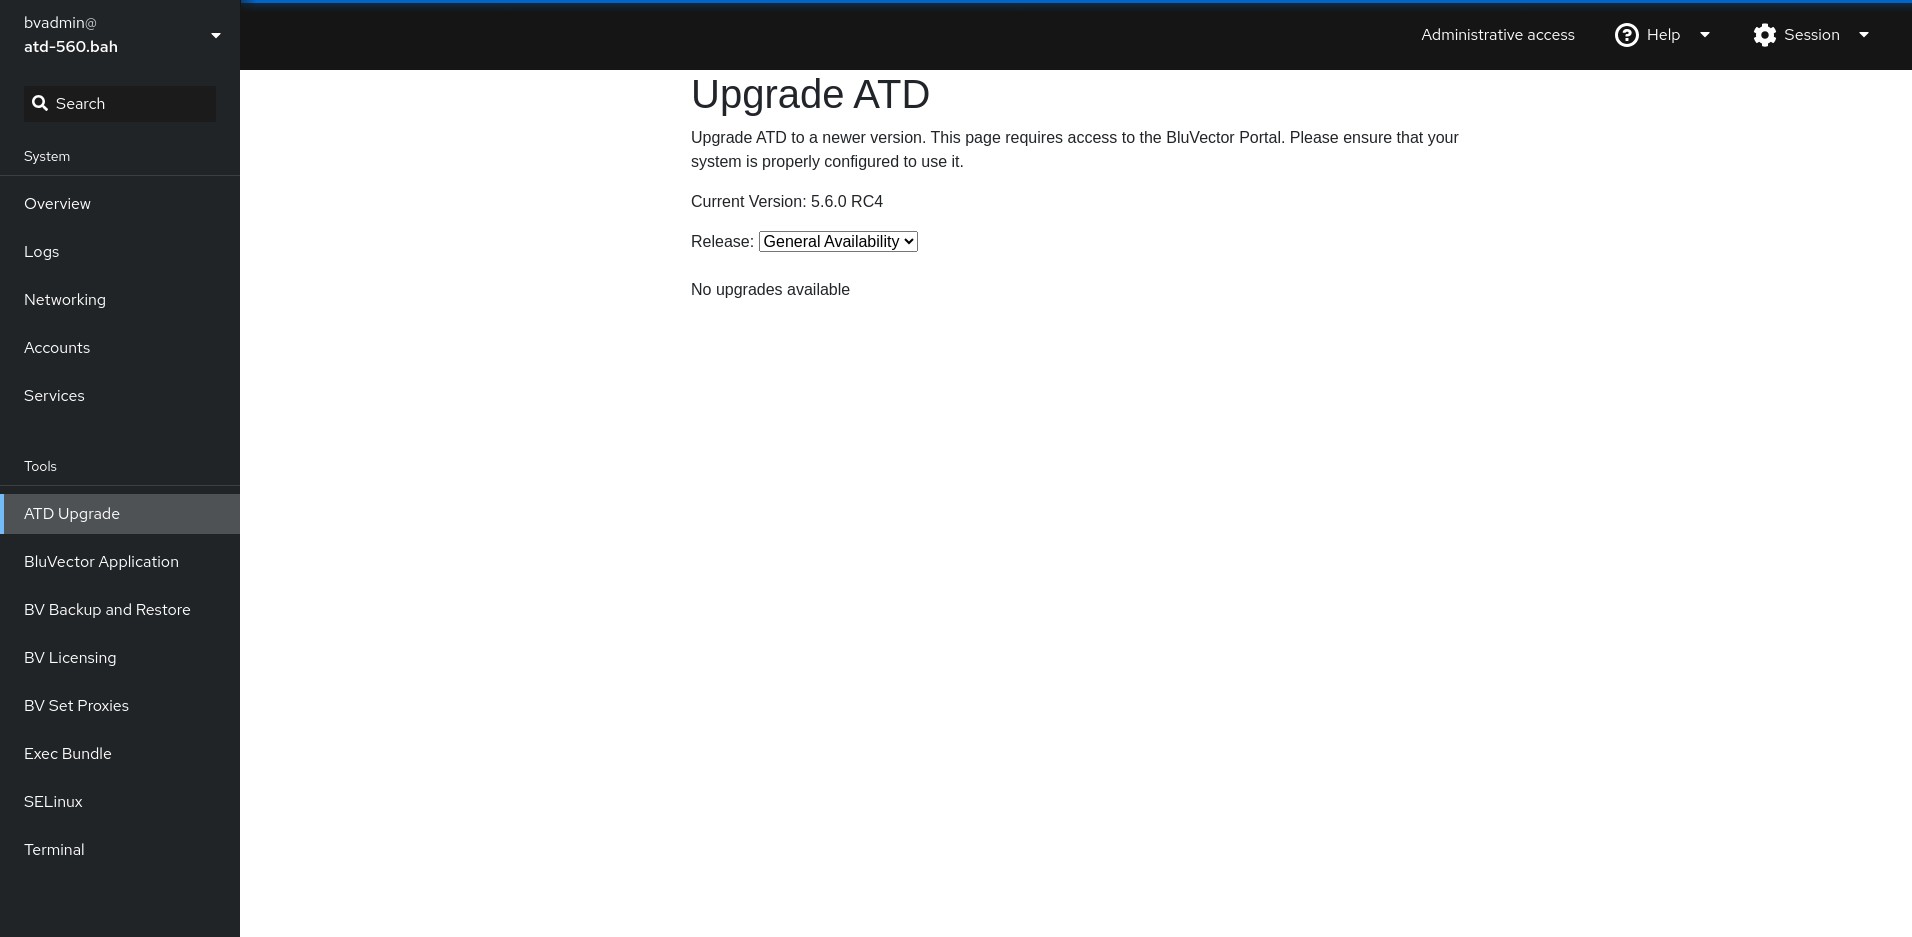
Fig. 118: Upgrade ATD Screen
The screen will display the current version. Select the ‘Release’ dropdown to choose what type of release you need, such as General Availability, Long Term Support, or Limited Availability. Any available upgrades will be shown.
General Availability - Releases that are widely available and include the latest features
Long Term Support - Releases available on the track for less frequent upgrades
Limited Availability - Early releases that are available to selected sites
To perform the upgrade, select Upgrade for the chosen release.
Wait for the upgrade to download and complete its installation. This will take several minutes.
Wait for system reboot to complete.
Log back into Cockpit, or continue the session after reboot completes.
Wait for the sensor container to report as running. Several other containers should also be reporting as running at this time.
The upgrade is complete.
Repeat for all other BluVector systems in your environment.
Upgrading the System in an Air-Gapped Network
The following procedure describes how to upgrade BluVector when the network is air-gapped, without connection to the Internet.
Procedure: Upgrade BluVector Without an Internet Connection
Follow these steps for an air-gapped network. This procedure is applicable for both a BluVector Collector and an ATD Central Manager.
Contact Customer Support for the following items, which will be needed for the upgrade (see Section: Contacting Customer Support):
Upgrade Package
Analytics Update Exec Bundle
On the BluVector ATD Host, copy the Upgrade Package tarball to
/var/tmp/. The most common copy command is:scp <path/to/tarball> username@hostname:/var/tmp/Verify that the tarball is in
/var/tmp/by executing:ls /var/tmp/Execute the software upgrade using:
sudo atd-upgrade <path/to/tarball>Wait for the system to upgrade, then reboot once it’s finished:
systemctl rebootLog back into Cockpit.
Upload the Analytics Update Exec Bundle using Cockpit through the ‘Exec Bundle’ menu option. Analytics updates may be performed separately from software upgrades.
Conducting System Restart and Shutdown
You can conduct a soft reboot or system shutdown through Cockpit. During reboots, system services will be unavailable until BluVector ATD Host and all hosted containers have completed starting up. The following procedure provides more details.
Procedure: Perform System Restart or Shutdown
Follow these steps to restart or shut down the system:
Log in to Cockpit (see Section: Logging into BluVector ATD Host).
Select Overview. The “Cockpit System Overview” Screen appears.
Select either Reboot or Shut Down from the drop-down menu showing ‘Reboot’.
Confirm the action by selecting Reboot or Shut Down in the confirmation window.
Configuring User Accounts
You may add, edit, and remove local user accounts through Cockpit. New users are created as non-administrator accounts. The following procedures explain the details to:
Add, modify, or remove a local user
Configure remote users and Active Directory (see Section: Configuring Remote Users and Active Directory)
Set up PolicyKit authorizations (see Section: Configuring PolicyKit Authorizations)
Procedure: Add a Local User in Cockpit
Follow these steps to add a local user account:
Log in to Cockpit (see Section: Logging into BluVector ATD Host).
Select Accounts. A list of accounts appears.
Select Create New Account. The “Create New Account" Screen in Cockpit appears (see Figure: Create New Account Screen in Cockpit).
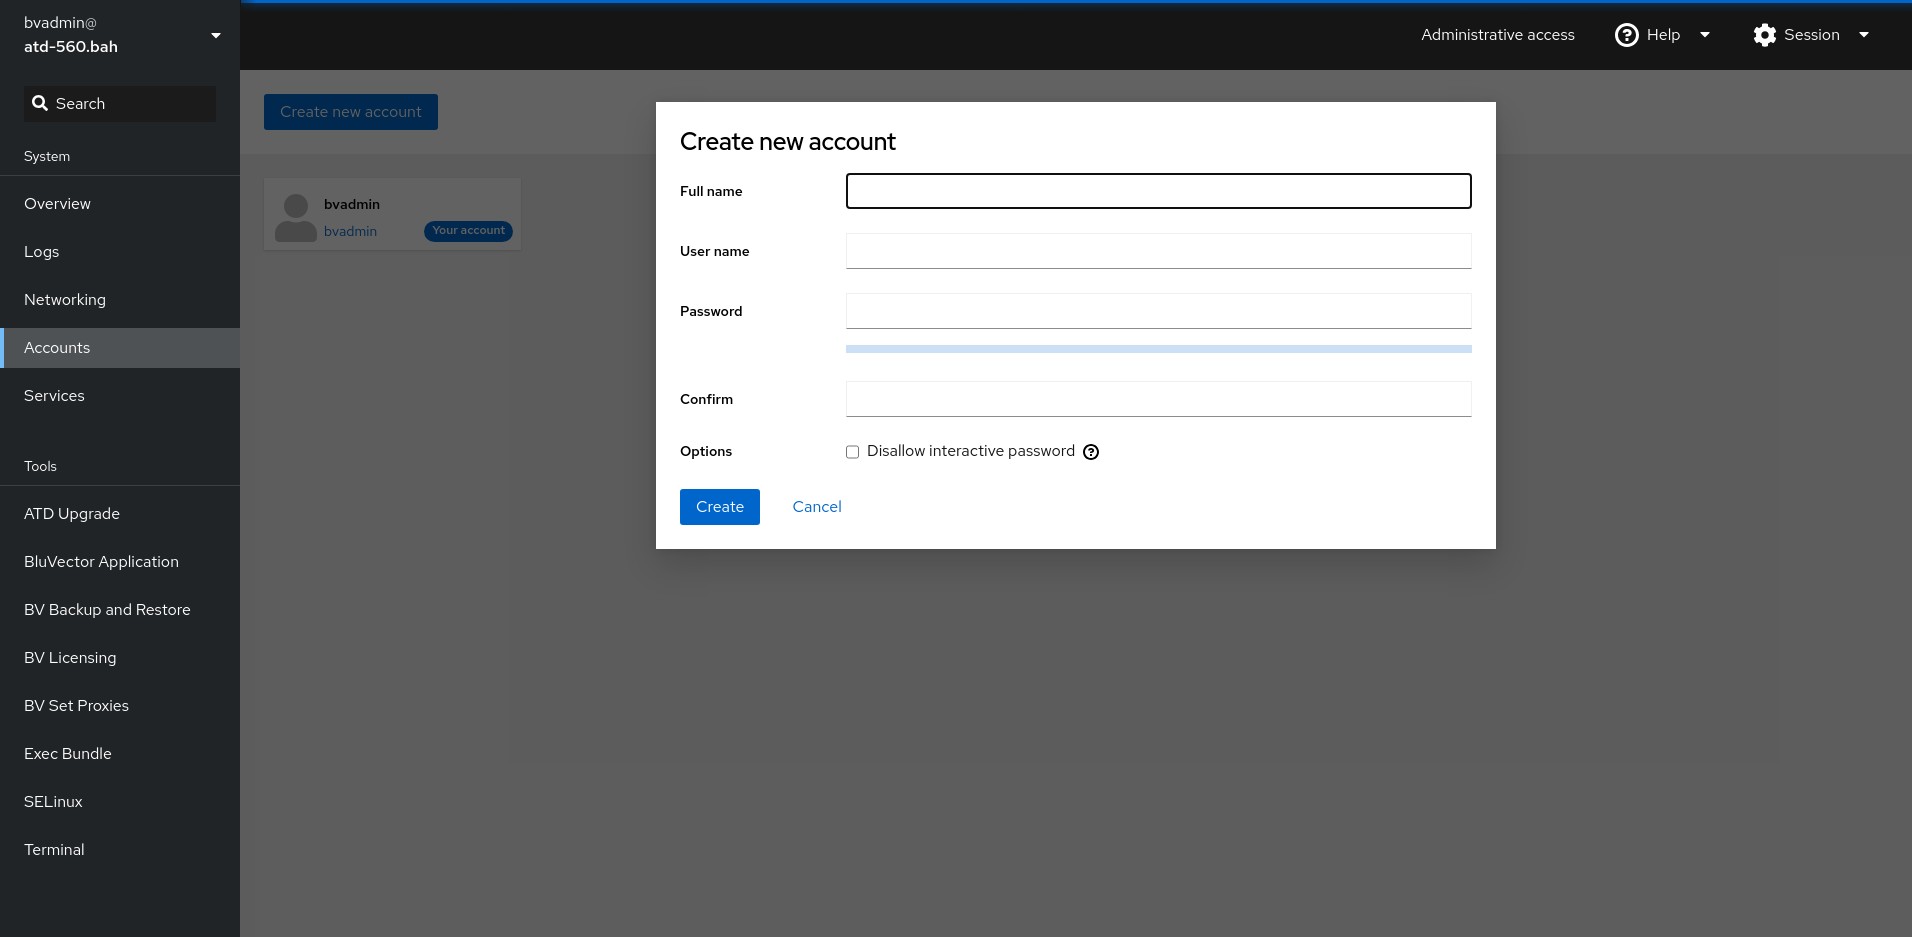
Fig. 119: Create New Account Screen in Cockpit
Fill in the fields. ‘User Name’ and ‘Password’ are required fields.
Select Create.
Procedure: Modify or Remove a Local User in Cockpit
Follow these steps to modify or remove a local user account:
Log into Cockpit (see Section: Logging into BluVector ATD Host).
Select Accounts. A list of accounts appears.
Select the user account you wish to edit or delete. Details appear in a new screen.
If you wish to change information, you can:
Modify the ‘Full Name’.
Grant one of the following roles. A change in role becomes effective the next time the user logs in.
BluVector Administrator - able to perform all configuration tasks
Lead Analyst - able to perform limited configuration tasks and view administrative notifications
User - able to perform regular user tasks
Lock the account.
Set or change the password.
Configure SSH keys for this account.
If you wish to delete the account, select Delete. You will be prompted to confirm. You may choose whether to delete the user’s home directory contents.
Configuring Remote Users and Active Directory
The BluVector ATD Host can authenticate users that are managed externally in Microsoft Active Directory (AD) by joining the machine to the AD Forest. The following requirements are prerequisites for successful join operations:
The user has domain credentials with machine Join privileges.
The BluVector ATD Host Fully Qualified Domain Name (FQDN) is in a domain under your AD forest.
BluVector ATD Host is configured for DNS resolution against the AD domain. For example, SRV & TXT lookups must succeed.
BluVector ATD Host and AD times are in sync.
The following procedures describe how to join and unjoin an Active Directory Domain.
Procedure: Join or Unjoin an Active Directory Domain
Follow these steps to join or unjoin an Active Directory Domain:
Log into Cockpit (see Section: Logging into BluVector ATD Host).
Select System. The “Cockpit System” Screen appears.
To join a domain:
Select Join Domain. A window pops up for you to enter information (see Figure: Cockpit System Screen Window Popup for Joining a Domain).
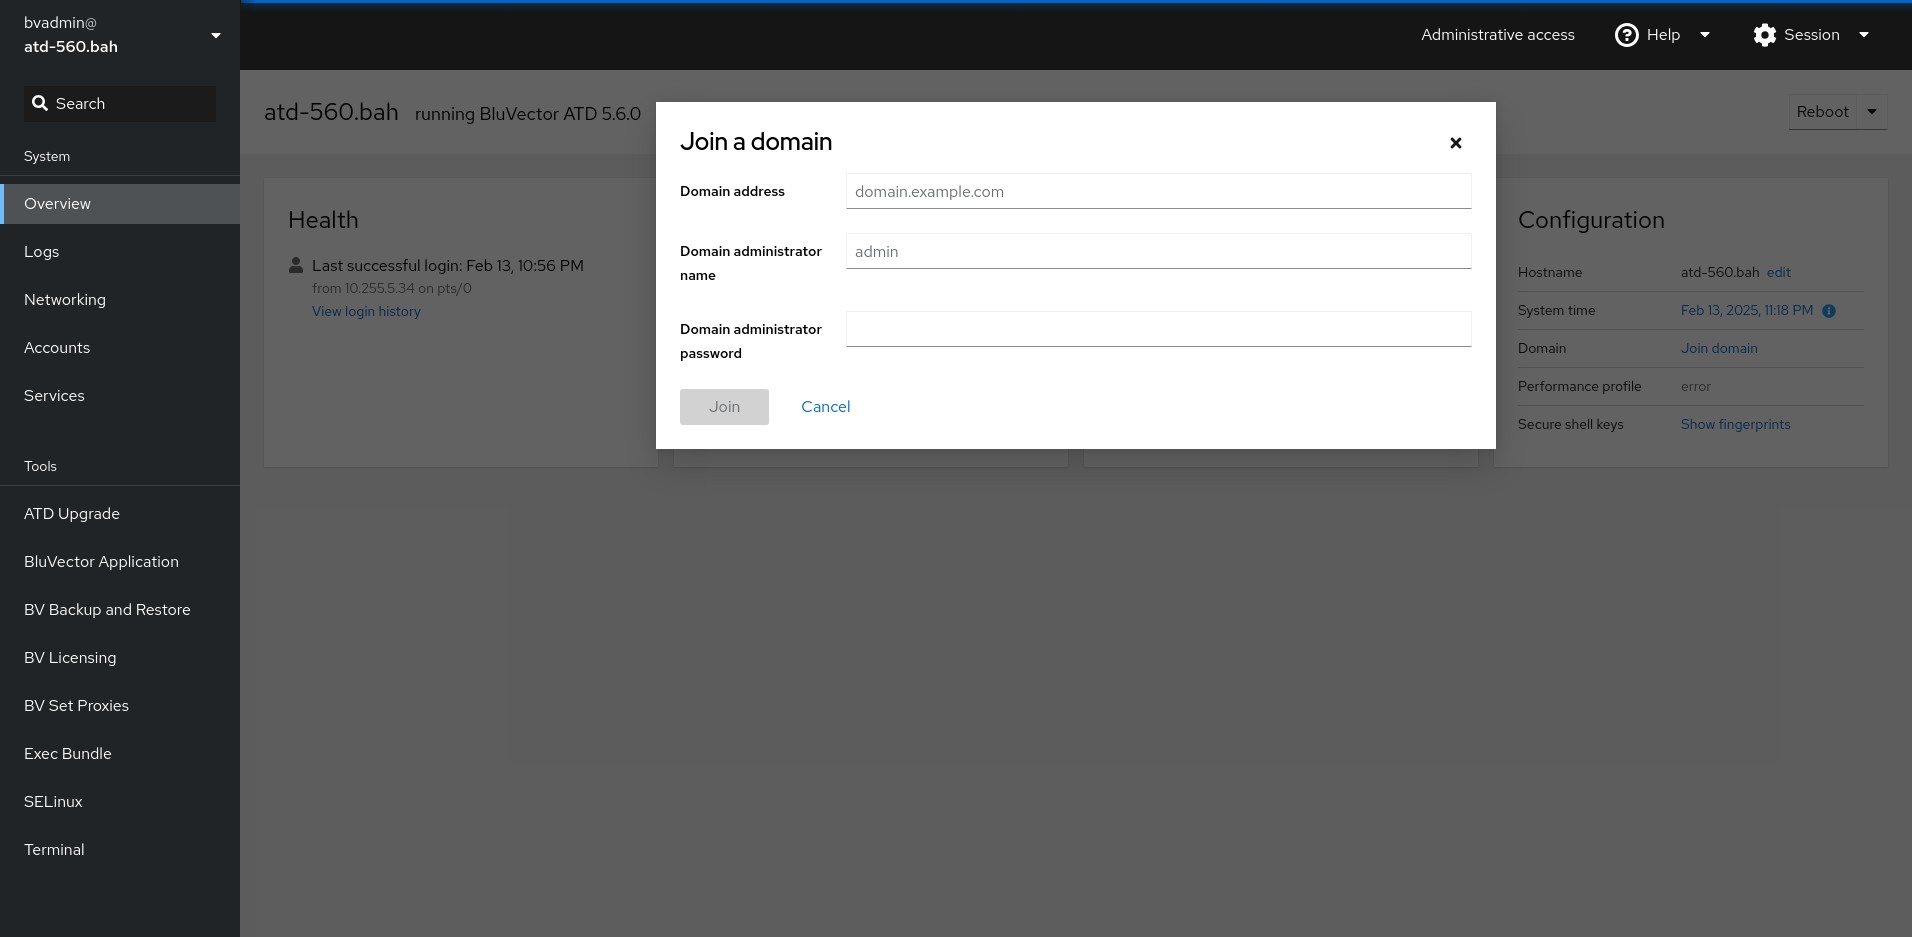
Fig. 120: Cockpit System Screen Window Popup for Joining a Domain
Enter the FQDN of an AD Domain Controller. If the DNS prerequisite is met, you can update the screen with the ‘Domain Administrator Name’ and ‘Domain Administrator Password’. Usernames that are managed externally will be in the form
username@<domain>. When such a username is supplied for login, on either the Cockpit or SSH interface, the supplied password will be validated against the Active Directory password for that user.Select Join. A few moments later, the joined domain name will appear in place of the Join Domain link.
To unjoin, select the domain name on the “Cockpit System Overview” Screen and confirm that you wish to unjoin. When a system is unjoined from a domain all user accounts associated to that domain will be automatically deactivated.
If users are being added as a group, you must also configure the system to accept that group as a BluVector Administrator, Lead Analyst, or Regular User group (see Section: Managing the System Settings).
Configuring PolicyKit Authorizations
When connecting BluVector ATD Host to Active Directory, there are likely to be groups of users in Active Directory that should also have Server Administrator privileges. BluVector ATD Host management interfaces are under a policy management framework called PolicyKit. Before any Active Directory user is permitted to administer BluVector ATD Host, an existing administrator must author a local policy file to declare the domain group or groups that should also have Server Administrator privileges. The following procedure describes how to set up these privileges.
Procedure: Set up Server Administrator Privileges for Remote Groups
Follow these steps to allow server administrator privileges for certain remote groups:
Open a text editor and create a new file called
/etc/polkit-1/localauthority.conf.d/ DOMAIN.conf, where DOMAIN is the Active Directory domain name. This can be done from the BluVector ATD Host terminal (see Figure: BluVector ATD Host Terminal).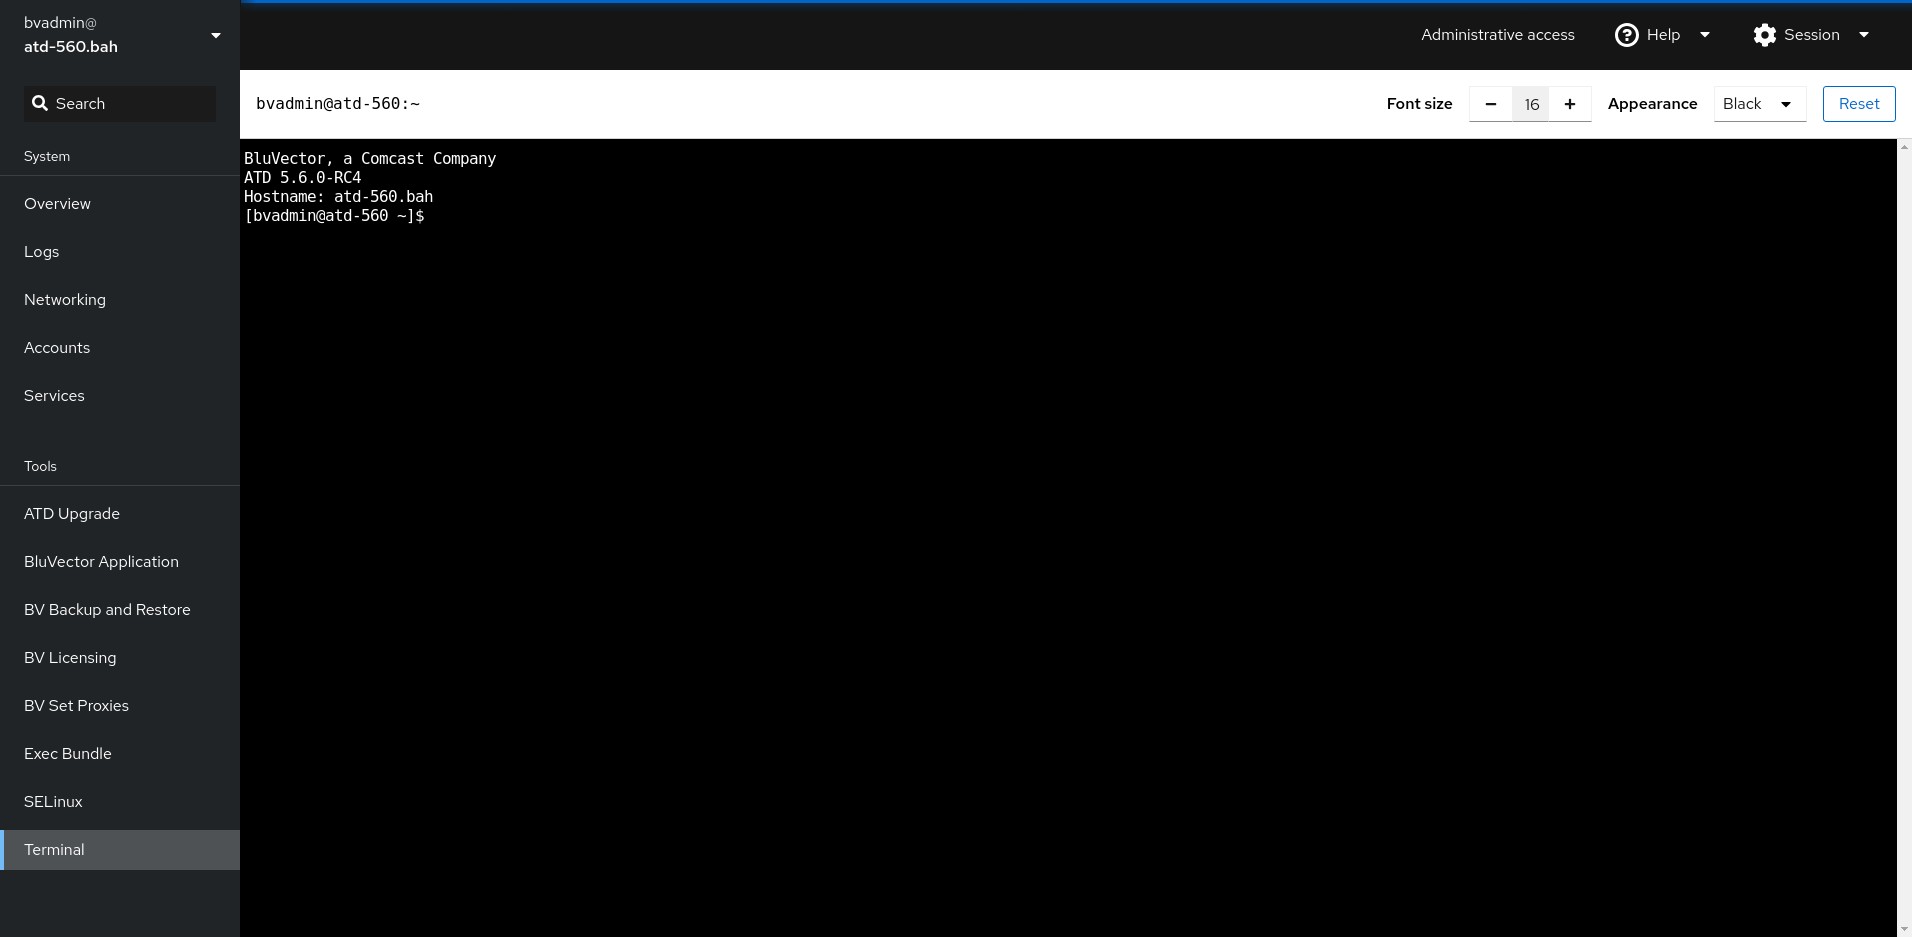
Fig. 121: BluVector ATD Host Terminal
Add the following content:
[Configuration]
AdminIdentities=unix-group:GROUP_NAME@DOMAIN
Where, GROUP_NAME and DOMAIN are replaced with appropriate values.
AdminIdentities is a semicolon delimited list, for example:
AdminIdentities=Existing_Entries; unix-group:GROUP2_NAME@DOMAIN
Configuring Remote NTP
BluVector ATD Host includes the chrony service, which is an implementation of NTP. You can only configure the chrony service through a command-line interface. It can only be altered by an administrator account. The procedure below describes how to configure it.
Procedure: Configure NTP
Follow these steps to configure NTP:
Log in to Cockpit (see Section: Logging into BluVector ATD Host).
Select Terminal. The “BluVector ATD Host Terminal” appears (see Figure: BluVector ATD Host Terminal).
Enter
vi /etc/chrony.confAdd the following line:
server NTP_HOSTNAME iburstwhere NTP_HOSTNAME is either the name or IP Address of an NTP server to sync with. Add one line per NTP server.
Save the changes and exit the vi editor.
Run:
systemctl restart chronyd.serviceTo enable the new server, run:
sudo chronyc online
Processing Exec Bundles
BluVector may provide Exec Bundles to support operation and maintenance of the system. Exec Bundles are specially crafted and cryptographically signed tar balls containing automated scripts and data designed to be executed from the BluVector ATD Host. These scripts may interact with one or more of the Docker containers on the system. Customer Support may request that you download and send them the output generated by an Exec Bundle. The following procedure describes how to upload an Exec Bundle.
Procedure: Upload an Exec Bundle
Follow these steps to upload an Exec Bundle:
Log in to Cockpit (see Section: Logging into BluVector ATD Host).
Select Exec Bundle. The “Upload an Exec Bundle” Screen appears (see Figure: Upload an Exec Bundle Screen).
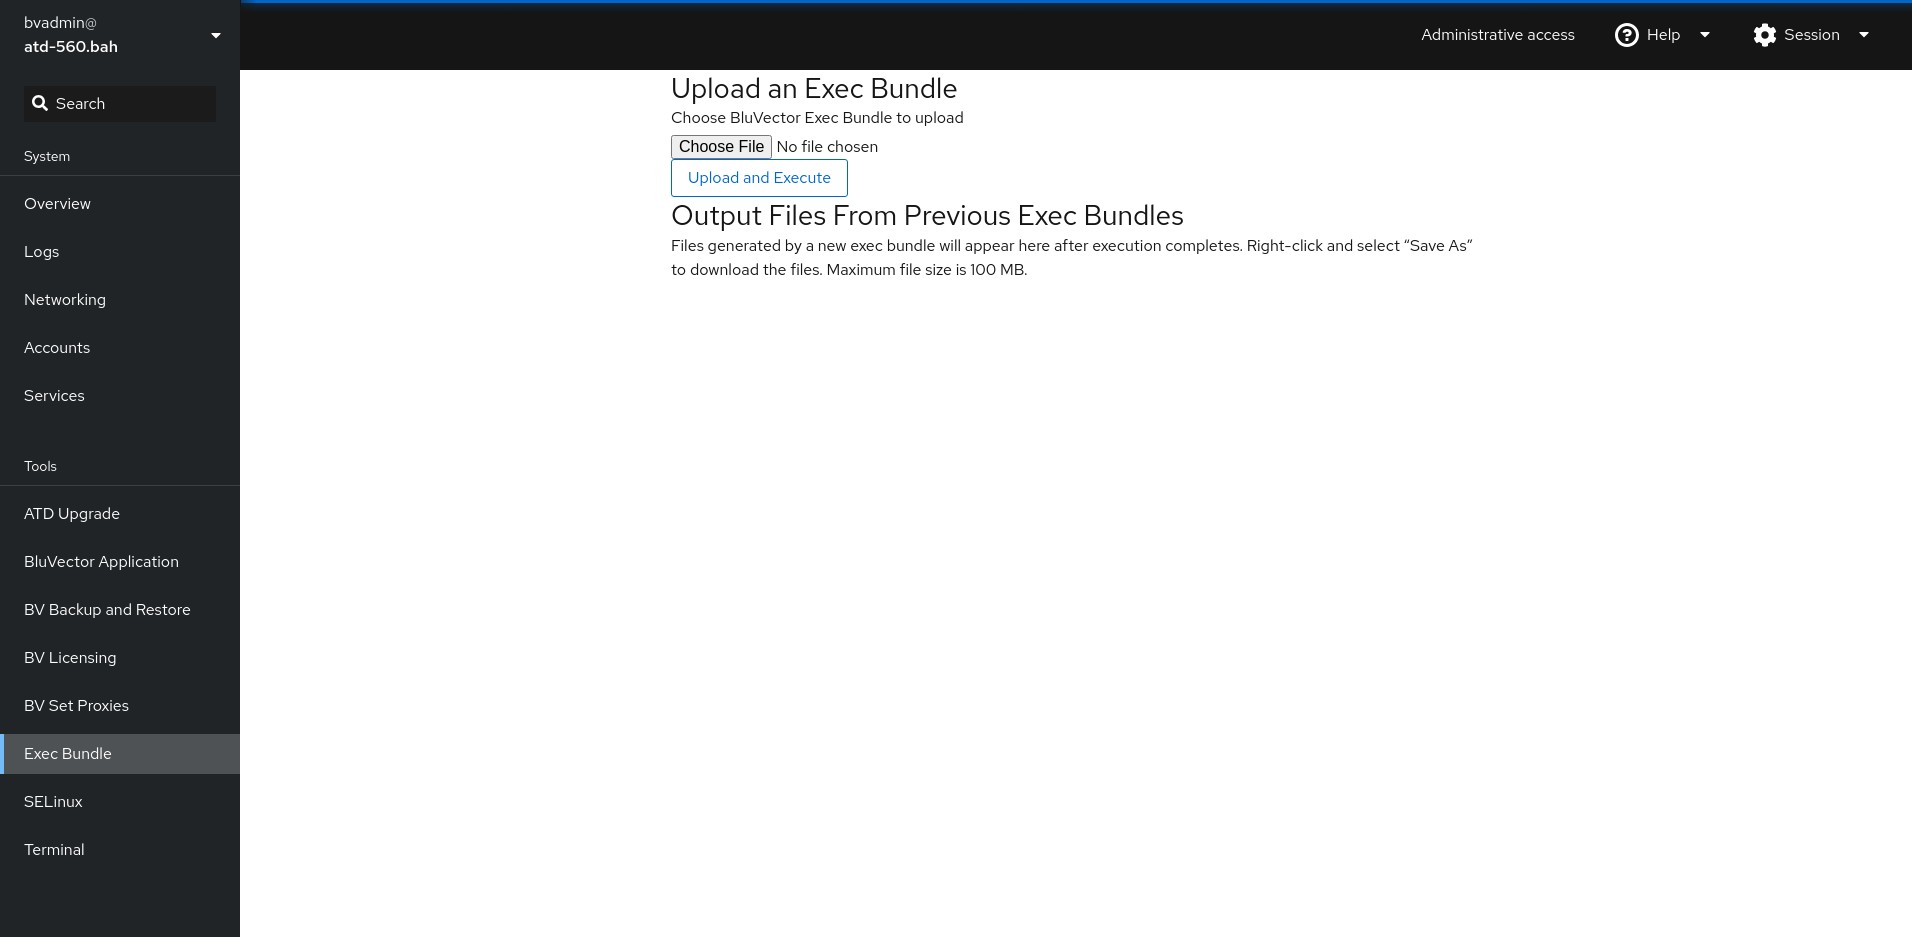
Fig. 122: Upload an Exec Bundle Screen
Transfer the Exec Bundle provided by Customer Support to your local machine.
Select Choose File and select the Exec Bundle from your local file system.
Select Upload. The Exec Bundle will run automatically as soon as the upload is complete.
Send any requested output artifact to Customer Support.
Backing Up and Restoring the System
BluVector can generate a backup file artifact that captures key system data and configurations. The backup and associated restore processes are executed from the BluVector ATD Host. Backup artifacts may be downloaded from the Cockpit GUI or copied from the system using scp. Similarly, backup artifacts can be copied to the system using the Cockpit GUI or scp to the /var/backup directory and then used to restore the system. The following items on the system are included in the backup process:
Start up directory including any hot patches that have been applied to the system
System configuration
All configuration file artifacts including but not limited to Zeek scripts, Suricata rules and thresholds, Yara rules and ClamAV signatures.
Suricata rule augmentations including thresholds and rule enablement/disablement
Adjudicated events
Custom Machine Learning Engine models
User account preferences and local user accounts
BluVector Enhanced Rules Management settings (only included if the Enhanced Rules Management container is installed on the system)
There are several important items NOT included in the backup artifacts including informational events, Zeek logs, files used for or eligible for retrains and files associated with suspicious events.
Backup artifacts may only be restored to systems of the same type and on the same version of software used to generate the backup.
Procedure: Generate a Backup Artifact On-Demand
Follow these steps to generate a backup artifact:
Log in to Cockpit (see Section: Logging into BluVector ATD Host).
Select BV Backup and Restore. The “Upload an Exec Bundle” Screen appears (see Figure: System Backup and Restore Screen).
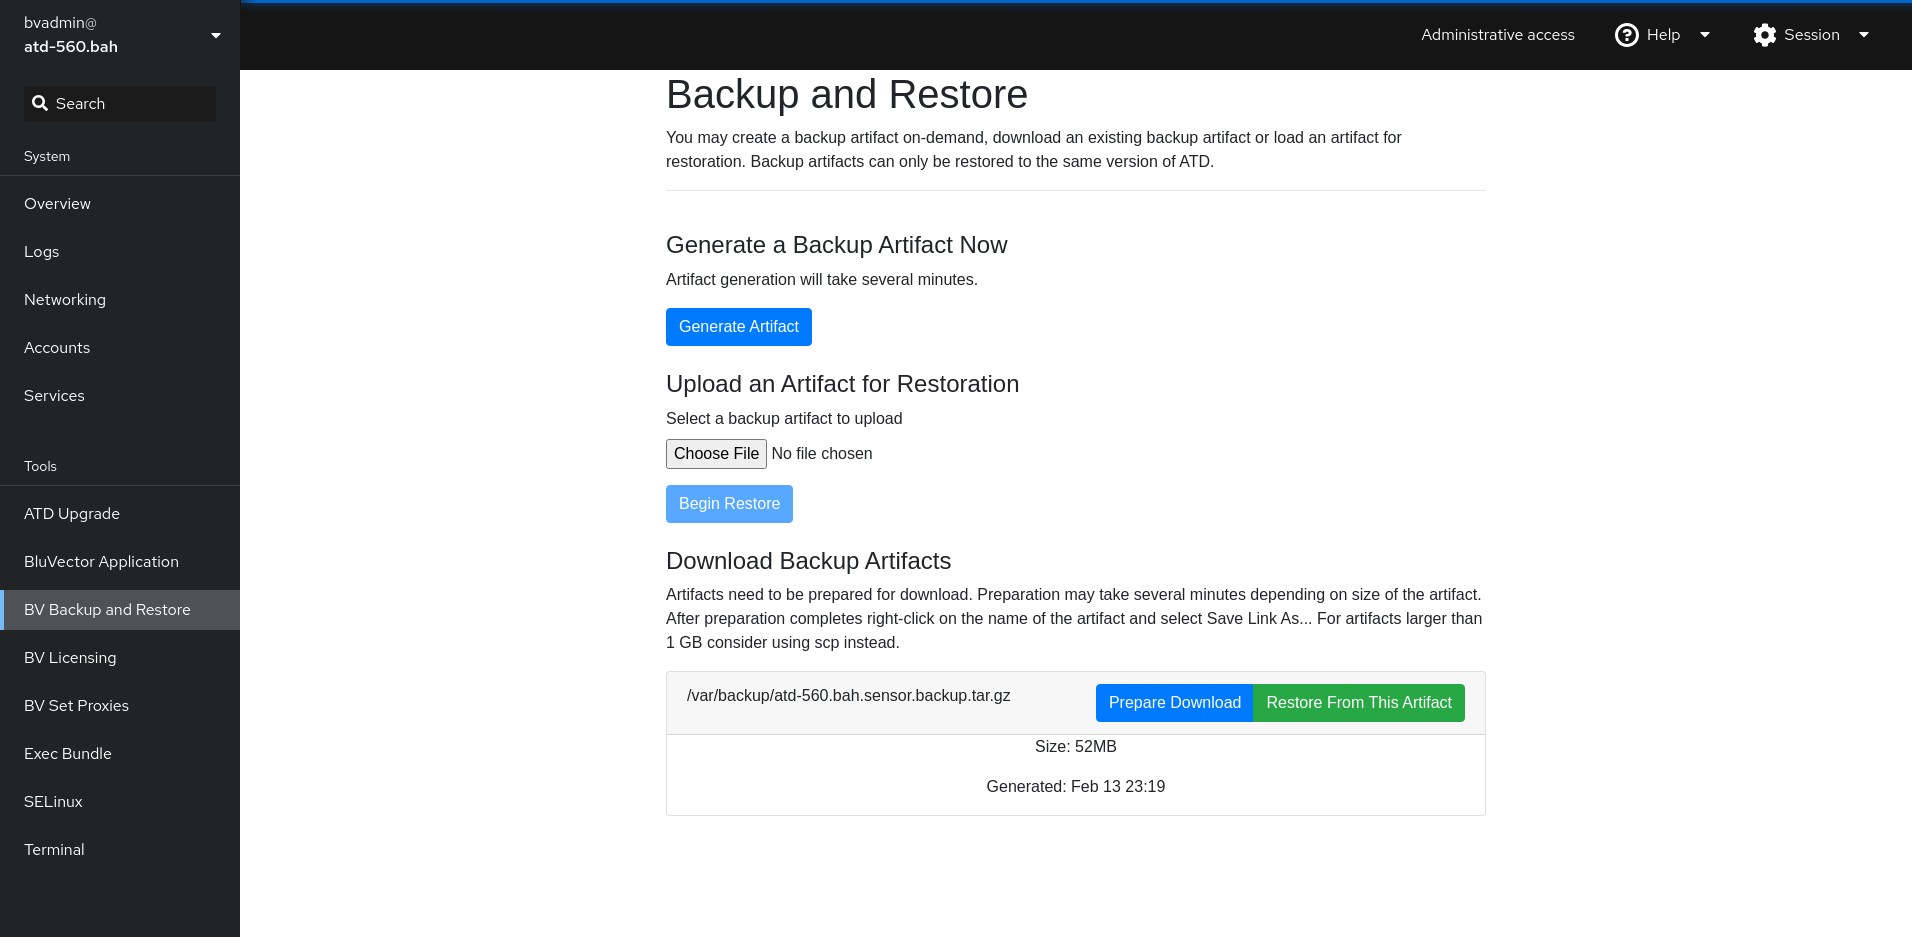
Fig. 123: System Backup and Restore Screen
Select Generate Artifact. This will build a new artifact in the
/var/backupdirectory calledbackup. tar.gzand replace any existing file of the same name.
Procedure: Restoring the System from a Backup Artifact Already On the System
Follow these steps to restore the system from a backup artifact:
Log in to Cockpit (see Section: Logging into BluVector ATD Host).
Select BV Backup and Restore. The “Upload an Exec Bundle” Screen appears (see Figure: System Backup and Restore Screen).
Select Restore From This Artifact on the desired artifact to be restored. Multiple backup artifacts may exist in
/var/backupand each will be presented with the option to restore from that artifact.
Procedure: Restoring the System from an Uploaded Backup Artifact
Follow these steps to restore the system from a backup artifact:
Log in to Cockpit (see Section: Logging into BluVector ATD Host).
Select BV Backup and Restore. The “Upload an Exec Bundle” Screen appears (see Figure: System Backup and Restore Screen).
In the Upload an Artifact for Restoration section, select Browse. Select the backup artifact file from your local file system and click Open. Select Begin Restore. This will transfer the artifact to the system and kickoff the restore process.
Note:
Backup artifacts can be large (i.e., greater than 100 MB). It is highly recommended when working with large artifacts to use
scprather than uploading or downloading through a browser.
Configuring System Proxies
In many network environments, proxy servers serve as a liaison to route traffic from networked devices to the Internet. The following procedure describes how to configure HTTP and HTTPS proxies.
Procedure: Configure the System Proxies
Follow these steps to configure the system proxies:
Log in to Cockpit (see Section: Logging into BluVector ATD Host).
Select BV Set Proxies. The “Proxy Configuration” Screen appears (see Figure: Proxy Configuration Screen).
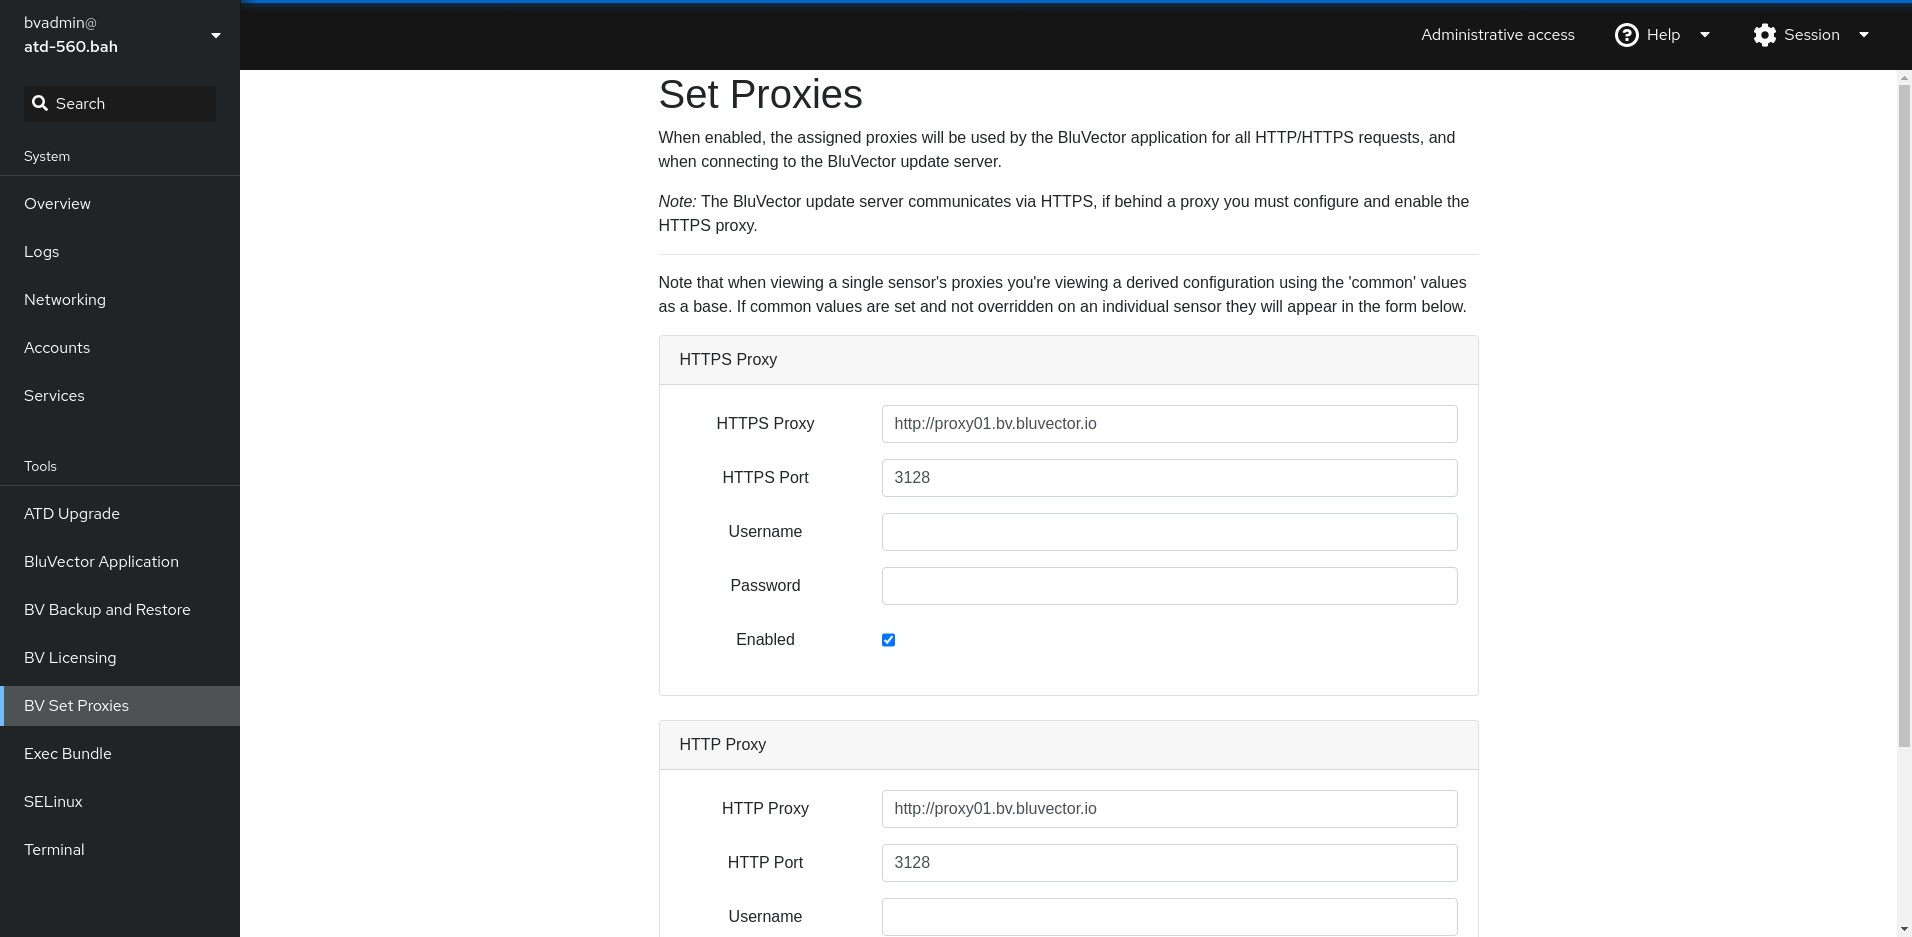
Fig. 124: Proxy Configuration Screen
To configure an HTTP proxy, enter the desired information in the following fields under the HTTP Proxy section:
Enter the HTTP proxy host’s address for ‘HTTP Proxy’.
Enter the port number in ‘HTTP Port’.
Enter the username in ‘Username’. This field is optional when the server proxy does not require authentication.
Enter the password in ‘Password’. This field is optional when the server proxy does not require authentication.
To enable the HTTP proxy, select Enabled. To disable the proxy, deselect Enabled.
To configure an HTTPS proxy, enter the desired information in the following fields under the HTTPS Proxy section:
Enter the HTTPS proxy host’s address for ‘HTTPS Proxy’.
Enter the port number in ‘HTTPS Port’.
Enter the username in ‘Username’. This field is optional when the server proxy does not require authentication.
Enter the password in ‘Password’. This field is optional when the server proxy does not require authentication.
To enable the HTTPS proxy, select Enabled. To disable the proxy, deselect Enabled.
Select Set Proxies when you are finished.
Joining BluVector Sensors to the ATD Central Manager
BluVector ATD Host features an inter-node private network to tunnel private service communication on a single TCP port. For example, the ATD Central Manager is a BluVector ATD Host node that expects to have collector nodes to manage. an ATD Central Manager is given control over a BluVector Sensor through the joining process. A BluVector Sensor or BluVector Virtual Machine under control of an ATD Central Manager is referred to as a BluVector Collector.
When a BluVector Collector is unjoined from its ATD Central Manager, that BluVector Collector reverts back to a stand-alone BluVector Sensor. You can view additional information about the state of the joining for a particular BluVector Collector or the ATD Central Manager by selecting ? on the “Central Manager Cockpit Join” Screen (see Figure: Central Manager Cockpit Join Screen).
A BluVector Grid refers to a system of BluVector Collectors and their ATD Central Manager. BluVector ATD
Host supports establishing and tearing down a BluVector Grid. Through the ATD Central Manager, stand-alone BluVector Sensors (hardware or virtual appliance) can be converted to BluVector Collectors under the control of the ATD Central Manager.
The following procedures describe how to join a BluVector Sensor to the ATD Central Manager, as well as how to unjoin a BluVector Collector.
Procedure: Join a Sensor to the Central Manager
Follow these steps to join a BluVector Sensor to the ATD Central Manager:
From the ATD Central Manager, log into Cockpit (see Section: Logging into BluVector ATD Host).
Select BV Join. The “Central Manager Cockpit Join” Screen appears (see Figure: Central Manager Cockpit Join Screen).
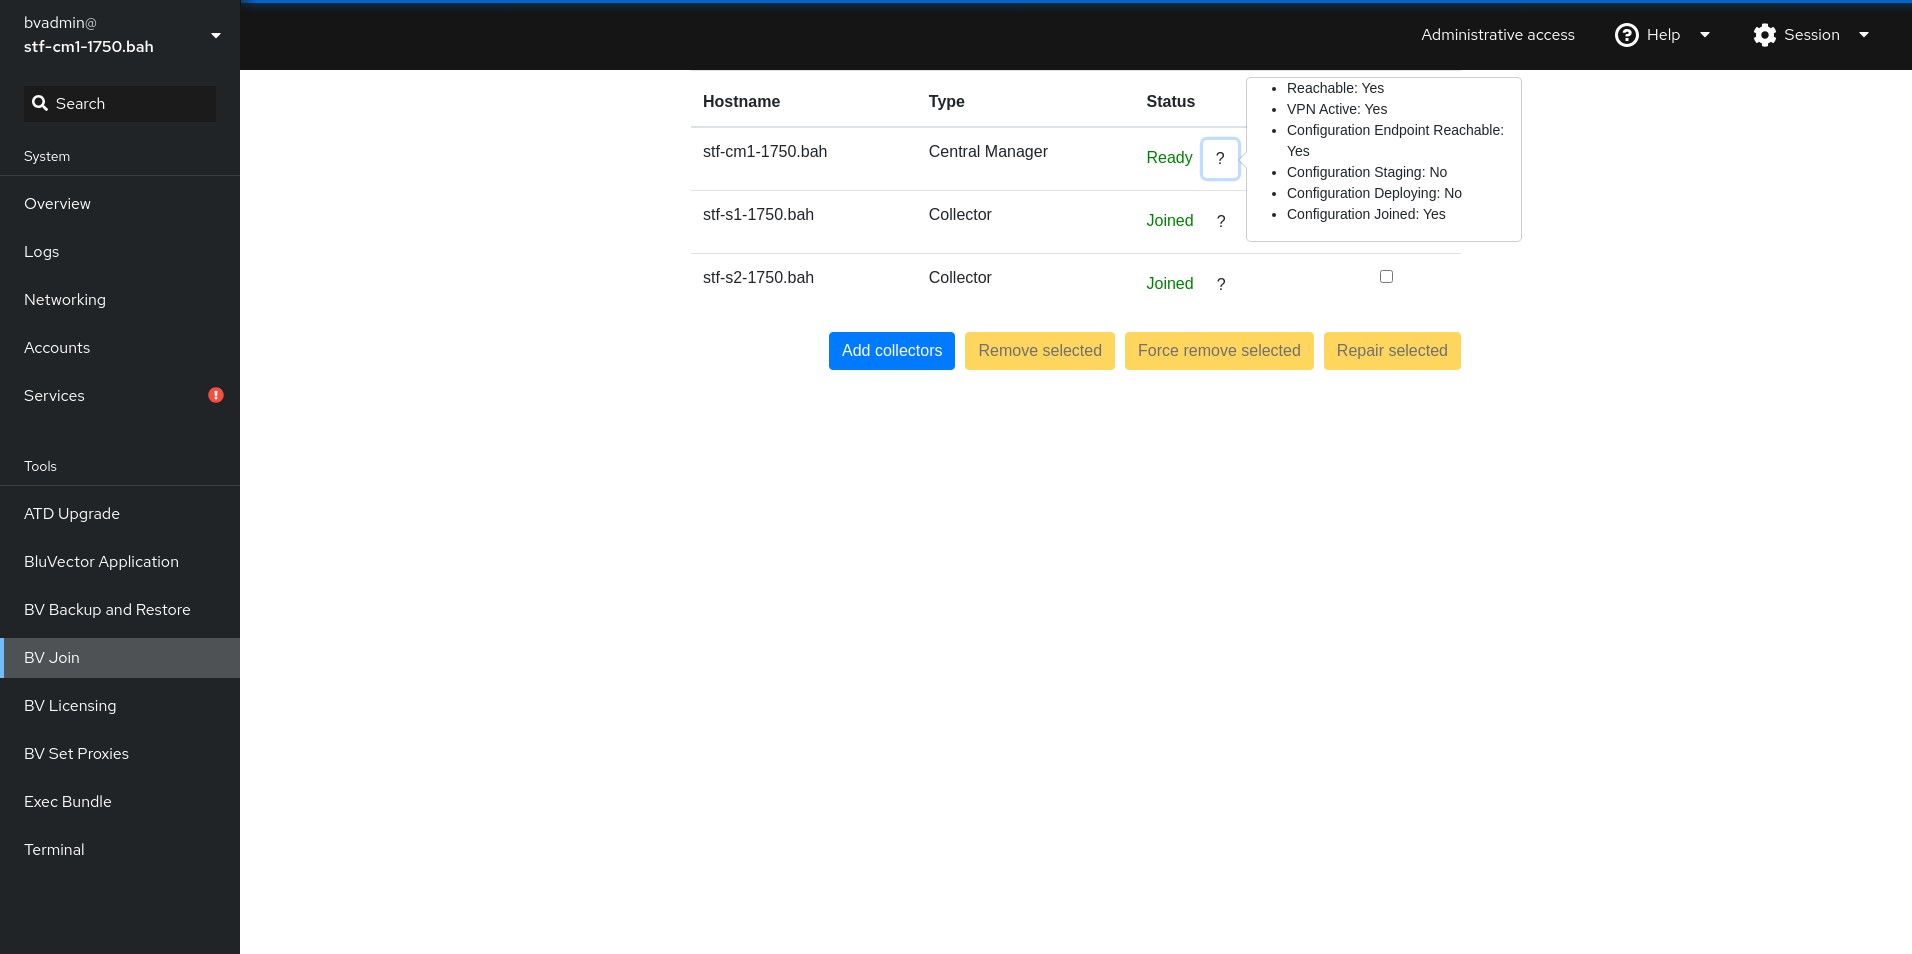
Fig. 125: Central Manager Cockpit Join Screen
Select Add collectors.
Enter the BluVector Collector’s hostname, valid username, and password for an administrator account on that BluVector Collector.
If you are joining multiple BluVector Collectors, select Add Another and complete the form for each BluVector Collector.
Select Join. This kicks off the join process, which can take several minutes to complete. Informational messages will appear during the process.
Procedure: Unjoin a Collector from the Central Manager
Follow these steps to unjoin a BluVector Collector from the ATD Central Manager:
From the ATD Central Manager, log into Cockpit (see Section: Logging into BluVector ATD Host).
Select the ATD Central Manager in the table of servers.
Select BV Join.
Select the check box for each collector you wish to unjoin.
Select Remove selected. This kicks off the unjoin process, which can take several minutes to complete. Informational messages will appear during the process.