On a daily basis, you will typically follow the instructions and guidelines in this section to operate the BluVector System. You will need to first properly install and configure the system. See article: System Installation and article: System Configuration for more information on installing and configuring.
Most of your interaction with the system is likely to be through the ATD GUI. However, there are situations where you may prefer to carry out certain system operations using the command-line interface. All users may take advantage of SSH access.
Warning:
Following the instructions and guidelines in this section is key to the effective operation of the BluVector system. Operators are solely responsible for proper operation of this system.
The sections below provide more information on operating the system:
Section: Viewing and Managing Notifications
Section: Managing Dashboards
Section: Viewing Event Information
Section: Using the Threat Vector Workflow
Section: Searching Zeek Logs
Section: Evolving Machine Learning Engine Classifiers through On-Premises Learning
Section: Uploading Files
Section: Using Outputs
Section: Using the REST API
Section: Configuring SNMP Traps
Section: Updating License Files
Viewing and Managing Notifications
When there are system health alerts relevant to the logged in user, you can view and manage the notifications. The alert icon at the top of the screen will show a color dot indicator when there are messages to read.
To view the notifications, select the alert icon. A dropdown appears, showing the most recent messages (see Figure: Dropdown Displaying Most Recent Notifications).
From the dropdown, you can:
Select the trash can icon to remove a single message.
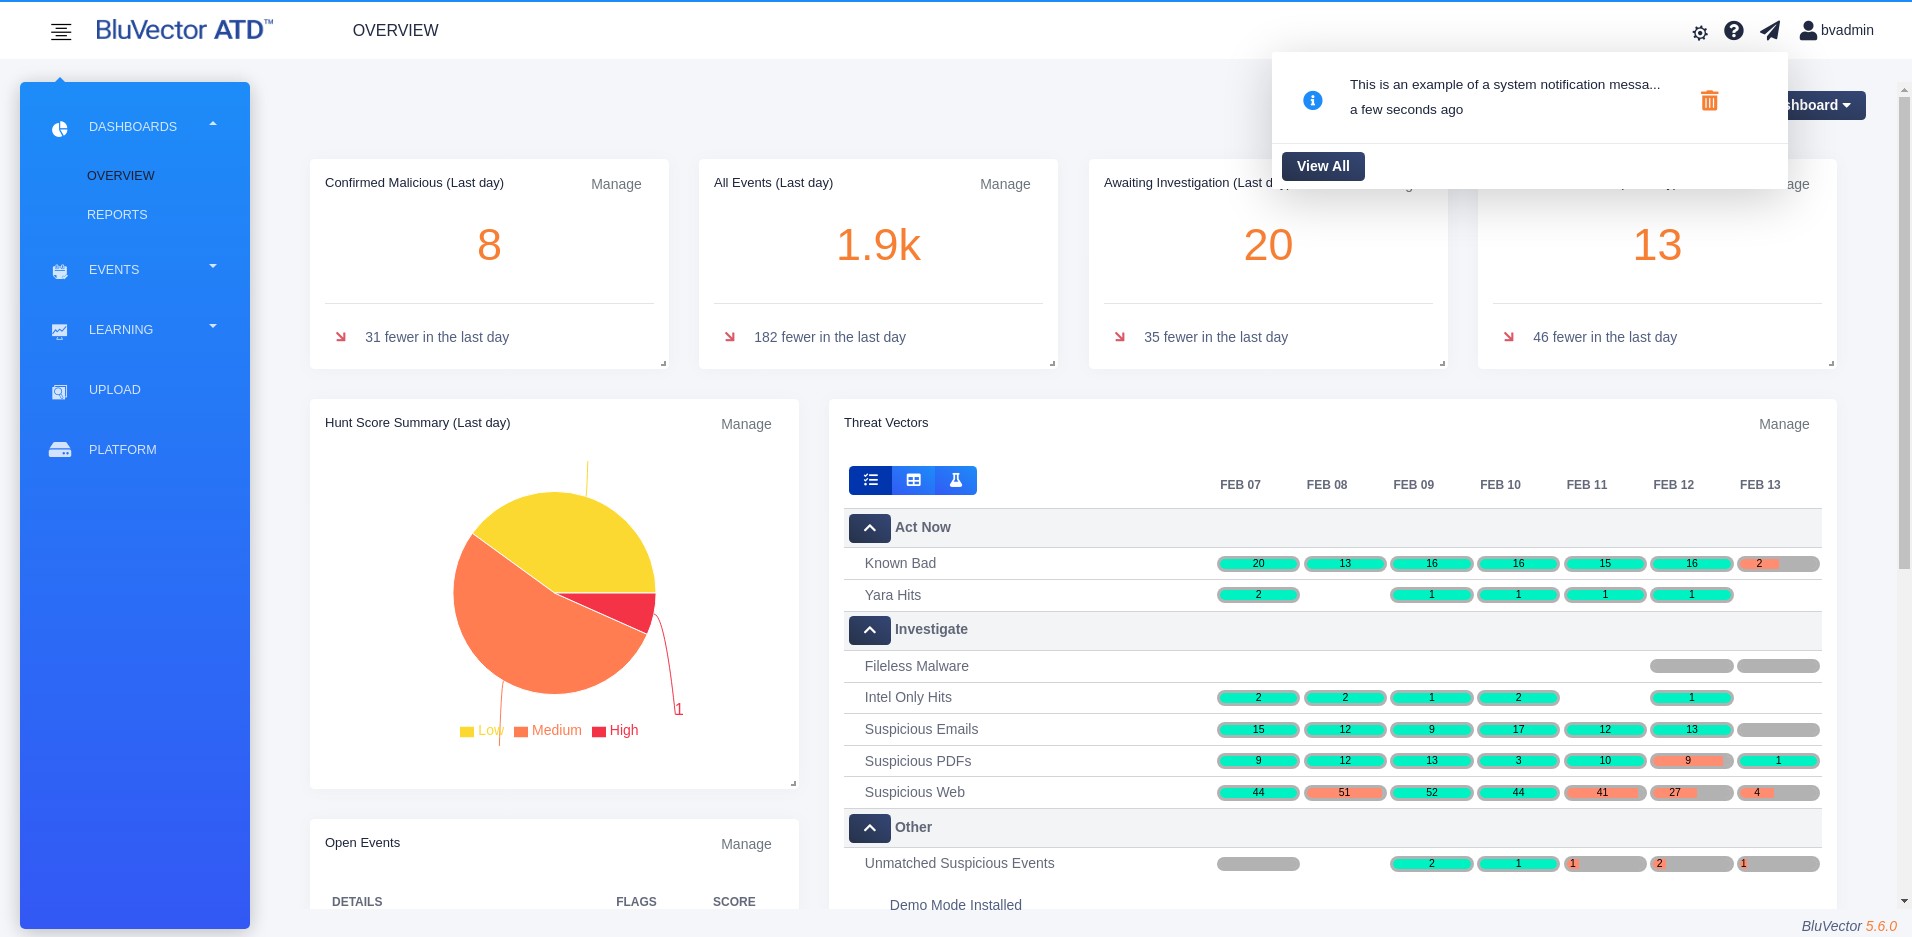
Fig. 9: Dropdown Displaying Most Recent Notifications
Select Dismiss All to remove all of the messages.
Select See All to bring up a screen showing all of the messages. The Notifications Screen appears (see Figure: Notifications Screen).
Managing Dashboards
When you log in to BluVector, a dashboard appears. The dashboard provides you with useful summaries of the events created by the system and interaction with those events. There are two default dashboards:
Overview Dashboard
Reports Dashboard
The dashboards provide an overview of analytic processing and a set of exportable reports. You can highly customize the dashboard and report system. You may also create additional custom dashboards, as well as configure which dashboard to show at login.
The following sections describe how you can manage the dashboards:
Section: Customizing Dashboards
Section: Using the Overview Dashboard
Section: Using the Reports Dashboard
Customizing Dashboards
The BluVector dashboards contain a set of configurable widgets. Each widget displays a certain type of information and can be independently moved and resized. The location and size of a widget are automatically saved after each change. You may want to create a new dashboard to customize the widgets in a certain configuration. The following procedures describe how to add and remove dashboards. To manage the widgets, see Section: Customizing Dashboard Widgets.
Procedure: Add a Dashboard
Follow these steps to add a new dashboard:
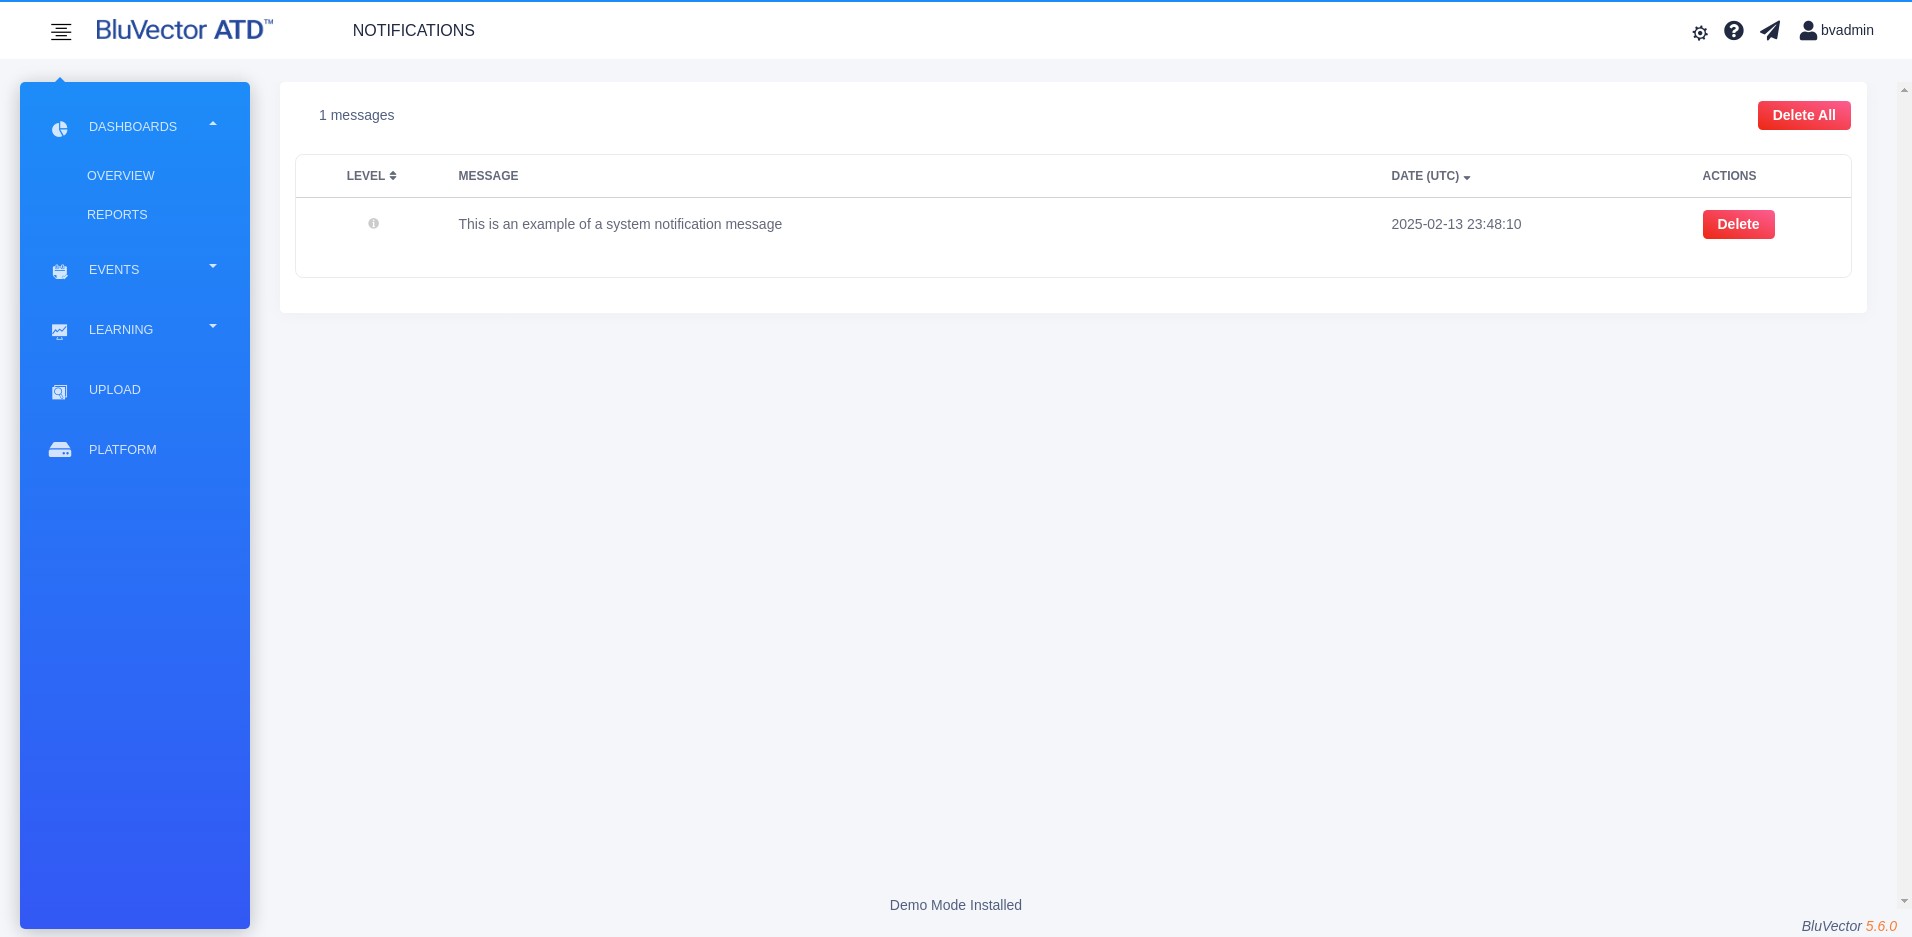
Fig. 10: Notifications Screen
The Notifications Screen displays a table with the following information:
Message
Date of the message
ACTIONS column
* To remove a single message, select Delete in the ‘ACTIONS’ column. To remove all of the messages, select Delete All at the top of the screen.
Log in to the ATD GUI (see Section: Logging into the ATD GUI).
Select Create Dashboard. The “Create Dashboard” Screen appears (see Figure: Dashboard Create Screen)
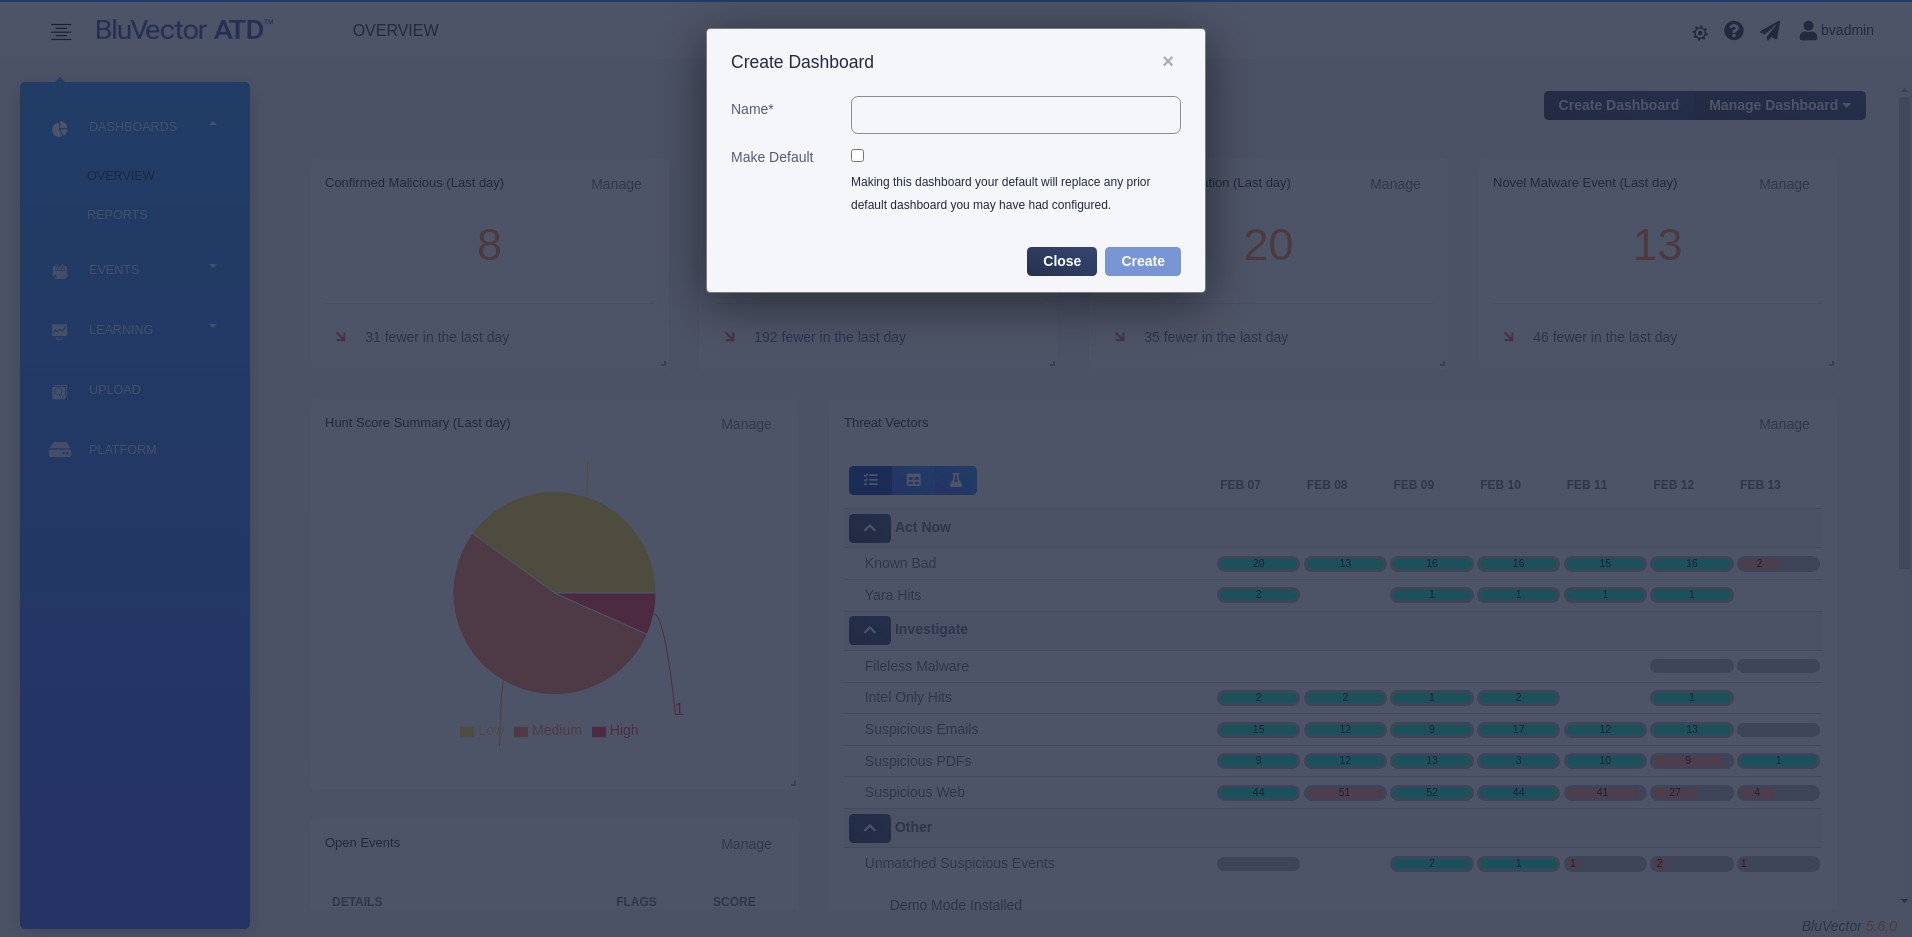
Fig. 11: Dashboard Create Screen
Enter a Name for the dashboard.
If you would like it to be the default dashboard that is opened on system login, select Make default.
Select Create.
Procedure: Remove a Dashboard
Follow these steps to remove a dashboard:
Log in to the ATD GUI (see Section: Logging into the ATD GUI).
Select DASHBOARDS from the menu on the left side of the screen.
Select the dashboard that you wish to delete.
Select Manage Dashboard.
Select Delete Dashboard from the menu that appears.
Select Delete.
Customizing Dashboard Widgets
There are many different types of widgets available for use in the BluVector dashboards. Most widgets are based on common use cases or popular reports. The Basic Widget and the Event Field Frequency Widget are the most customizable, and they display many different metrics captured by the system. Some widget types can export related data as a comma-separated value (.csv) file.
The following table describes the widget types. The procedures following the table describe how to add, move, resize, and remove widgets.
Widget Type | Description |
|---|---|
Activity Feed | Shows the most recent activity for certain actions within the system, along with the user who made the change. |
Average Time To Adjudication | Shows the mean time from when events are created to when either the user or system changes their status from Suspicious to Trusted or Malicious. |
Count Trend | Shows the count of all events, events awaiting adjudication, malicious events, or novel malware, along with a trend indicator showing whether the number has increased or decreased over the last configured time period. |
Data Flow | Shows a sankey diagram of event flow to the various analyzers in the system. |
Event Field Frequency | Provides a top/bottom N table for any event metafield. |
Event Status | Shows a breakdown of event status in the system. |
Geo Location | Displays a world graph of traffic for each country that is acting as either the source or destination. |
Hunt Score Summary | Shows a breakdown of event scores in the system, as either a pie chart or a bubble chart. |
Ingest Metric | Shows ingest-related statistics across collectors on an ATD Central Manager or on a standalone BluVector Collector. You can select whether to display Bits or Packets, as well as whether to show Received, Dropped, or both. The graph displays the requested data over time, which can be configured as the Last Day, Last Week, Last Month, or Last 60 Days. When the widget is displayed on an ATD Central Manager, the data will contain an entry for every BluVector Collector. |
Logged In Users | Shows the list of currently logged in users. |
Open Events | Shows a list of the latest suspicious events created by the system, sorted by their Hunt Score. |
Threat Vectors | Shows a breakdown of events in the configured Threat Vectors and progress bars, indicating how many have been adjudicated. |
User Adjudications | Shows a table of which users have adjudicated events. |
The following procedures describe how to add, move, resize, and remove widgets.
Procedure: Add, Move, or Resize a Widget
Follow these steps to add, move, or resize a widget:
Log in to the ATD GUI (see Section: Logging into the ATD GUI).
Select DASHBOARDS in the menu on the left side of the screen.
Select the dashboard you wish to edit.
Select Manage Dashboard.
Select Add Widget from the menu that appears. The “Add Widget” Screen appears (see Figure: Add Widget Screen).
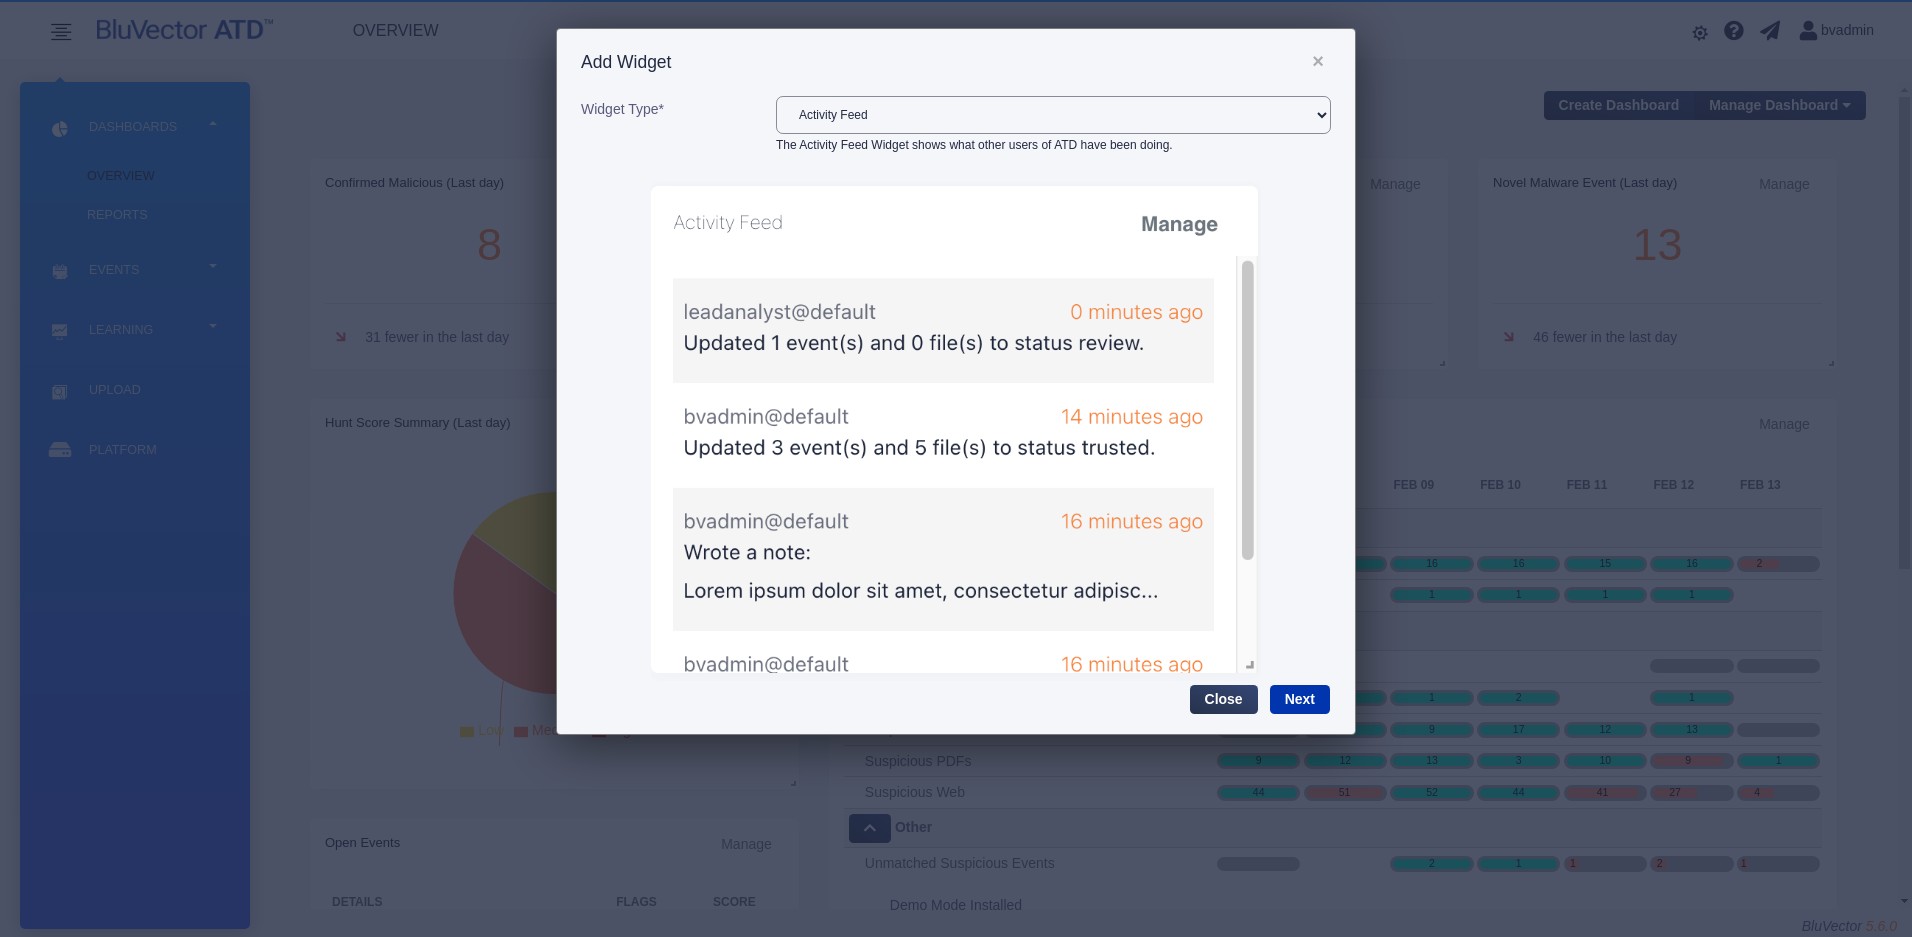
Fig. 12: Add Widget Screen
Select the desired widget type from the menu.
Select Next. The “Add Widget Details” Screen appears.
Configure the widget. Configuration settings vary, depending on the widget type. All required fields are marked with an asterisk (*). See Figure: Add Widget Details Screen for an example configuration screen.
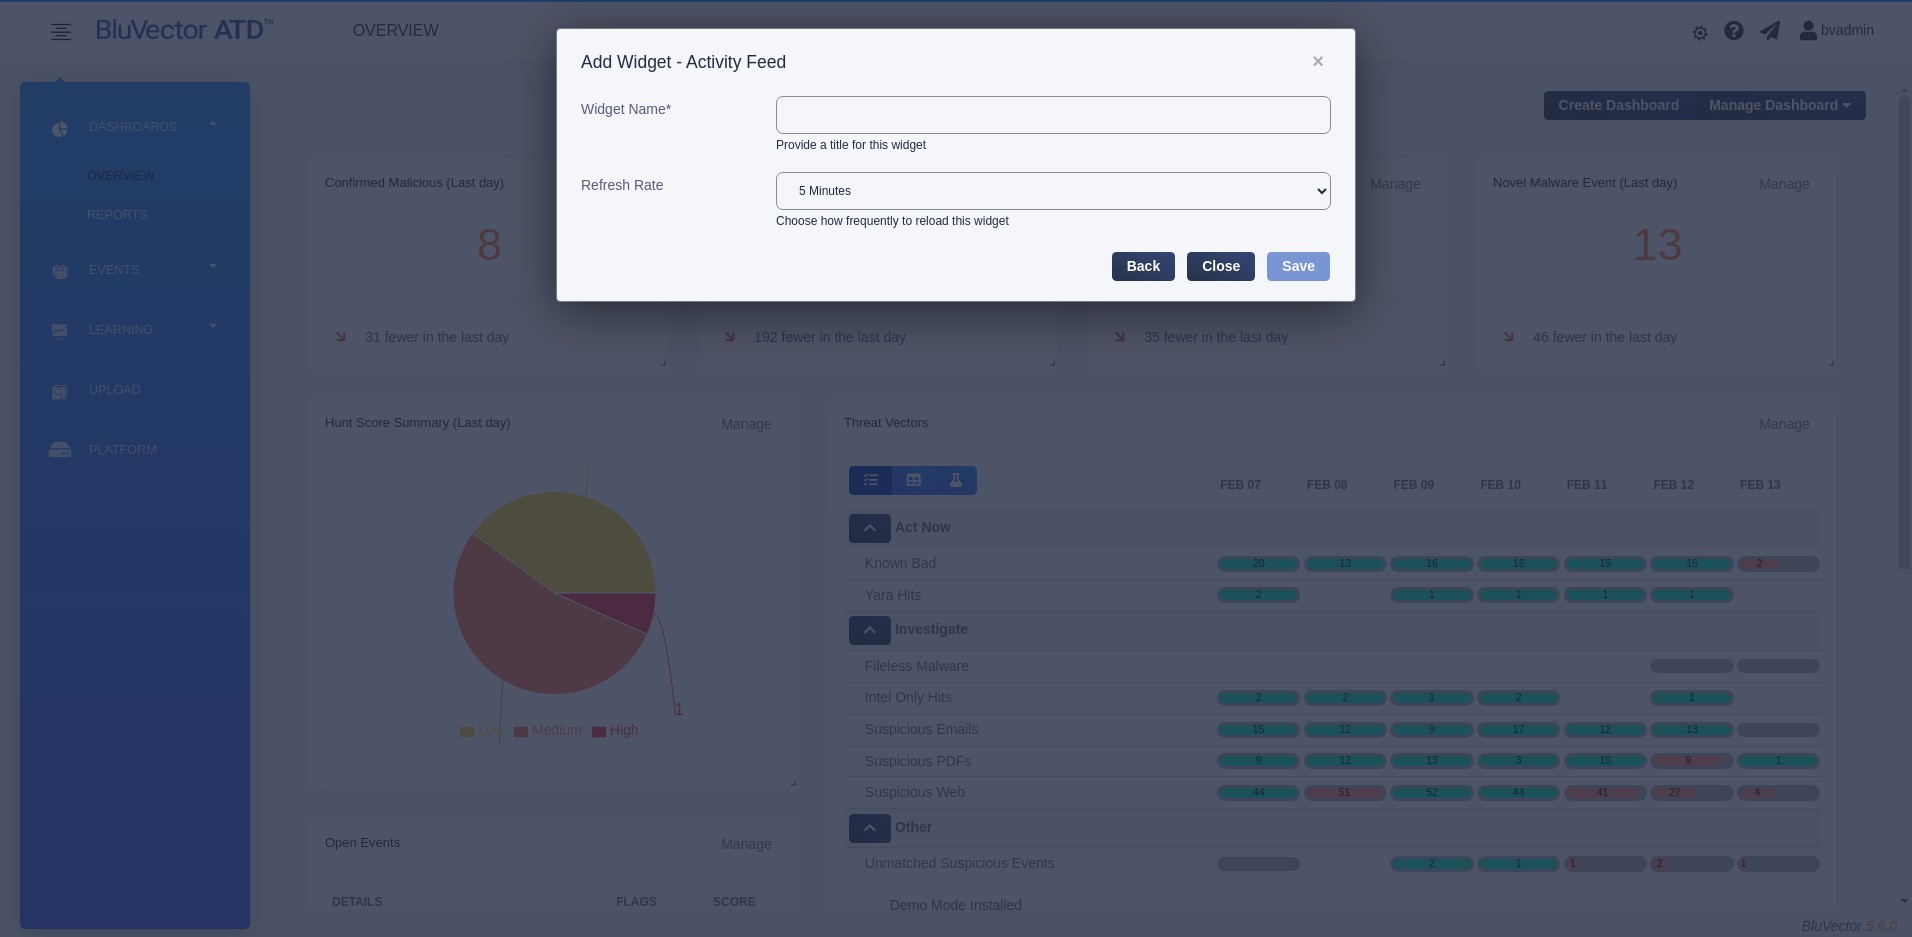
Fig. 13: Add Widget Details Screen
Select Save.
To move the widget, select and hold within the widget title area and drag the widget to its new location.
To resize the widget, move the mouse to the widget’s lower right corner, then drag the corner to the new desired size.
Procedure: Remove a Widget
Follow these steps to remove a widget:
Log into the ATD GUI (see Section: Logging into the ATD GUI).
Select DASHBOARDS in the menu on the left side of the screen.
Select the dashboard you wish to change.
Select Manage on the widget that you wish to remove.
Select Delete from the menu that appears.
Using the Overview Dashboard
The Overview Dashboard is one of the default dashboards available in the ATD GUI. To bring up the Overview Dashboard:
Expand the DASHBOARDS section in the left-hand menu.
Select OVERVIEW. The Overview Dashboard appears (see Figure: Overview Dashboard).
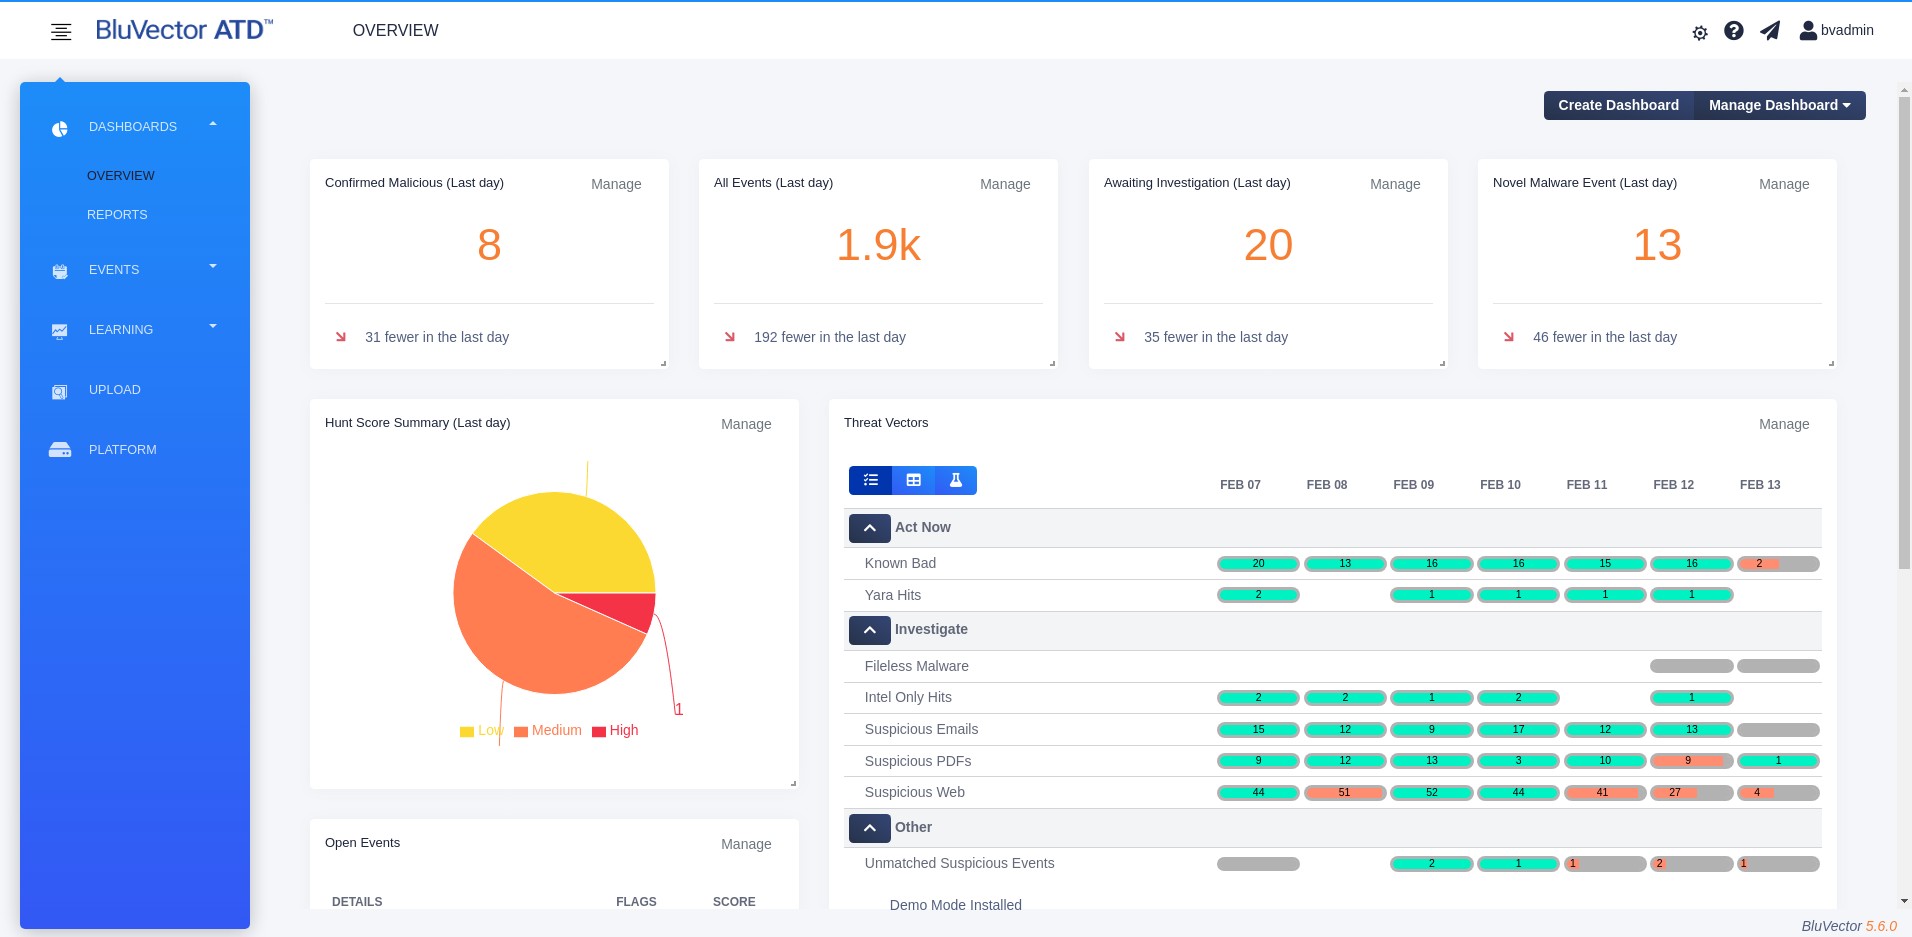
Fig. 14: Overview Dashboard
The Overview Dashboard provides a summary of the BluVector Grid, as well as the analytic work performed on the local BluVector Sensor (or the entire BluVector Grid if viewed from an ATD Central Manager with event forwarding configured). The local BluVector Sensor is the one that you are logged into. The other BluVector Sensors in the BluVector Grid are considered remote BluVector Sensors. You may select a BluVector Sensor in the grid and drill down to receive additional health and status metrics.
The Overview Dashboard displays summary statistics about the number of events observed by the local BluVector Sensor, the number awaiting adjudication, the number determined by the user to be malicious, and the number of novel malware events discovered. Novel malware is malware or ransomware identified by BluVector that has no signature. If you are upgrading from a previous version of BluVector ATD, you can add the Novel Malware Events widget to your Overview Dashboard through the dashboard configuration capability (see Section: Customizing Dashboard Widgets).
Other sections of the Overview Dashboard include:
Threat Vectors - Indicates the size and percent completion of each Threat Vector over the last seven days.
Hunt Score Summary - Provides a visualization of events by Hunt Score bins. It displays the relative quantity of events in a variety of Hunt Score range bins over the last 24 hours. Select any segment of the pie chart to bring up an event table listing all events in that segment.
Open Events - Shows a breakdown of recent events by event status and the top open events, prioritized by Hunt Score. It provides easy access to the latest and highest priority events. Select any event summary to bring up the detailed view of that particular event.
You can access, evaluate, and adjudicate events through any of these methods in the ATD GUI:
Threat Vector View – The specialized Threat Vector View allows you to quickly focus on a subset of contextually-similar, flagged content that is broken out on a daily basis for the past seven days.
Event Viewer – The Event Viewer provides access to all events on the system, as well as methods for querying and drilling-down into the event database.
Directly viewing a single event – from either an external URL (such as one provided by BluVector to SIEMs) or from the top Open Events widget.
Viewing the Threat Vectors Section of the Overview Dashboard
The Threat Vectors section of the Overview Dashboard displays a table that summarizes the work performed and the work remaining to be done by an analyst. The work consists of suspicious records that are collected into categories called Threat Vectors. The information in this section matches the Threat Vectors Overview. See Section: Viewing the Threat Vectors Overview for a description of this information and see Section: Using the Threat Vector Workflow for an explanation of the full Threat Vector Workflow.
Using the Reports Dashboard
The Reports Dashboard is one of the default dashboards available in the ATD GUI. To bring up the Reports Dashboard:
Expand the DASHBOARDS section in the left-hand menu.
Select REPORTS. The “Reports Dashboard” appears (see Figure: Reports Dashboard).
The screen displays many preconfigured report widgets. You can export any of the tabular reports as a comma-separated values (.csv) file. Exported reports include the counts for all unique values for the metafield over the configured time range and event status. The default report widgets are:
Destination Hostname
File Type
Suspicious Network Events
Malware Engine
Source IP
Destination IP
Emails To
Emails From
User Adjudications
Logged in Users (shows currently logged in users)
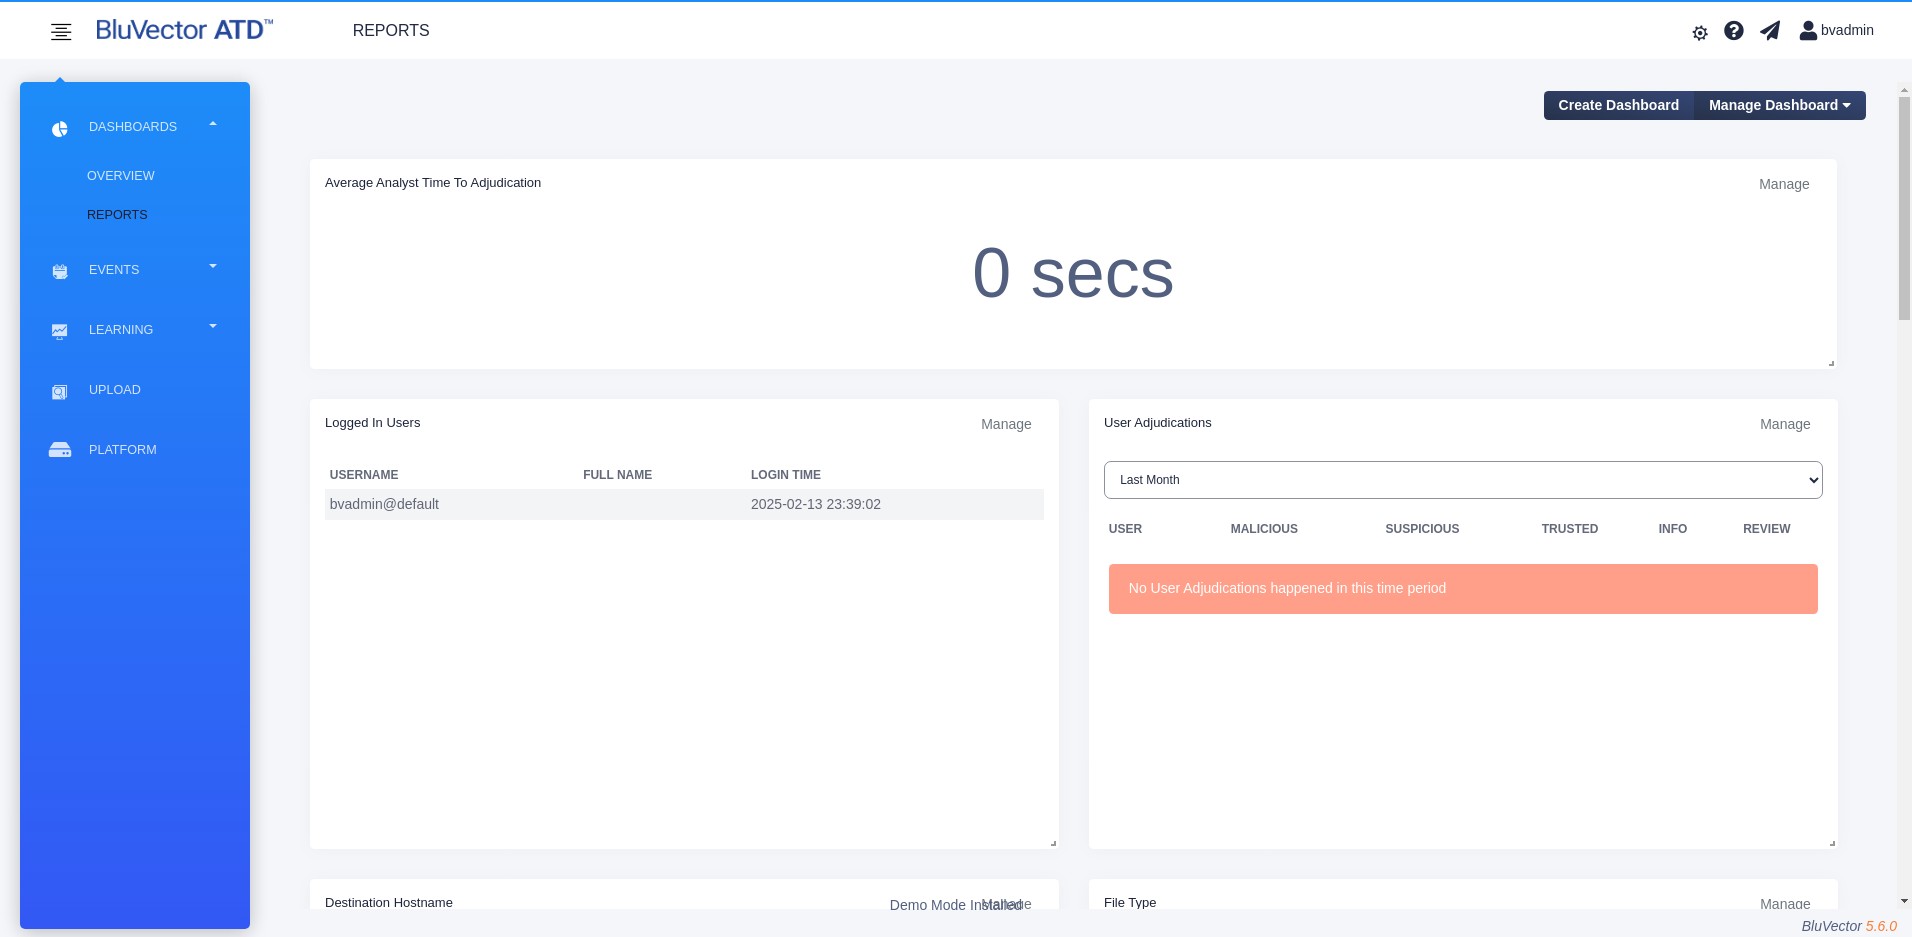
Fig. 15: Reports Dashboard
In addition, the Average Analyst Investigation Time over the last seven-day window will be reported. Analyst investigation time is the duration of time between the generation of a suspicious event and an analyst adjudicating that event as either Malicious or Trusted. Analysts will be routinely moving events from Suspicious to either Trusted or Malicious status, indicating that they have adjudicated the potential threat. Events that have not been adjudicated are not included in the calculation.
Note:
Reports are calculated over the events generated by BluVector. The statistics represent the frequency of the traffic containing content that BluVector has analyzed. These reports are not representative of all traffic observed and processed by the BluVector Sensor.
Viewing Event Information
You can view, query, and traverse all events and telemetry metadata that is generated by the BluVector System. Many options are available from the Event Viewer (see Section: Using the Event Viewer). The Event Viewer supports searching for events in multiple ways.
In addition, the “Search Zeek Logs” Screen (see Section: Searching Zeek Logs) assists in searching the history of all network transactions observed by BluVector. You can use it to find evidence of traffic related to important indicators (such as filenames, hashes, IP addresses, and hostnames), even if no event is produced by BluVector.
The following sections explain more about using the Event Viewer to view event information:
Section: Using the Event Viewer
Section: Using the Event Details Screen
Section: Using Field Enhancers
Section: Understanding Data Schemas
Section: Downloading Files and Data
Section: Learning about BluVector Dynamic Malware Analysis in the Cloud
Using the Event Viewer
The Event Viewer displays events as soon as they are collected and analyzed.
To bring up the Event Viewer:
Log in to the ATD GUI (see Section: Logging into the ATD GUI).
Select EVENTS from the menu on the left.
Expand the menu, then select EVENT TABLE in the submenu. The Event Viewer appears (see Figure: Event Viewer).
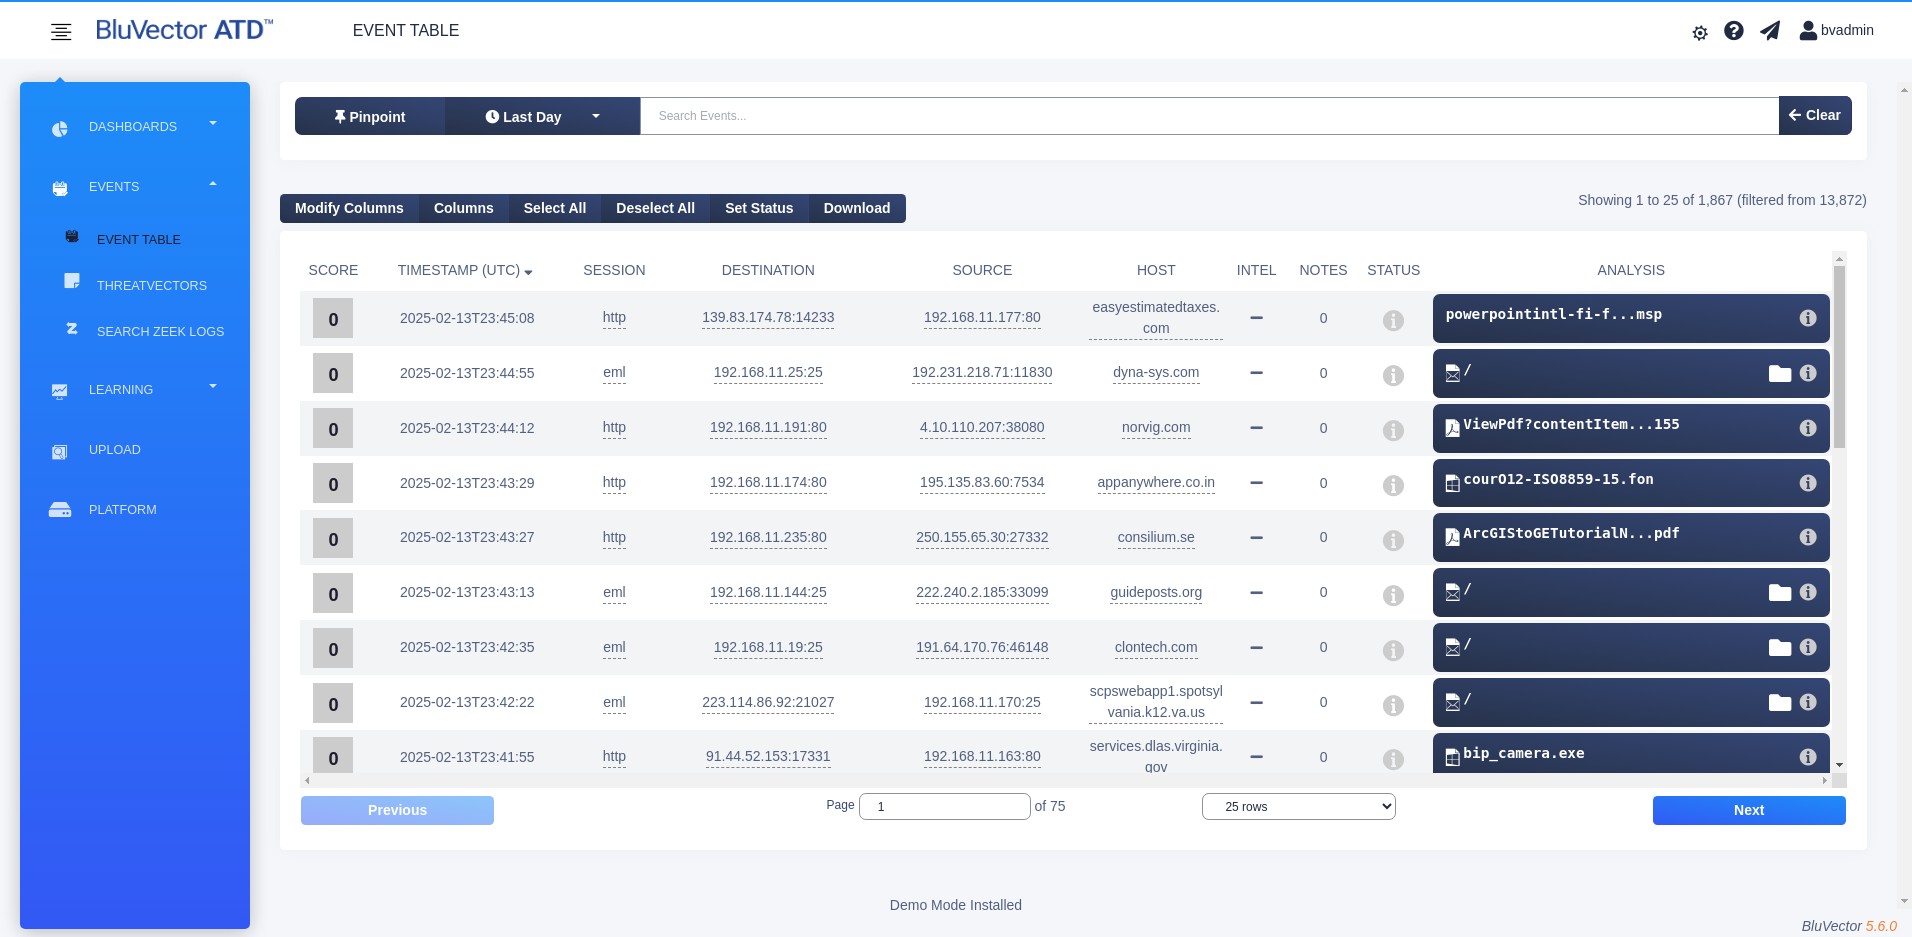
Fig. 16: Event Viewer
Each row in the Event Viewer represents a single event. If there are more events than will fit on the screen, select Previous and Next to navigate through the pages of data. Each row includes a summary of the most relevant event metadata, such as the event score, IP addresses, geolocation information, hostname, timestamp, and associated content.
Next to the destination and source IP addresses, a flag may appear for the country associated with the event. You can move the mouse cursor over a flag to see the name of the country.
You can select fields that are underlined for more options (see Section: Using Field Enhancers).
For an explanation of the schema that represents events and files, see Section: Understanding Data Schemas.
The default columns in the Event Viewer include:
SCORE – displays the event’s Hunt Score. Hunt Scores represent the priority an event should have for review. The scores do not represent estimates of event impact on the organization or sophistication of any potentially malicious content. All suspicious events should be reviewed. Scores range from 0 to a configurable maximum score (the default is 10), with higher scoring indicating events worthy of greater prioritization.
INTEL – displays a checkmark if an intelligence provider has flagged any of the metadata within an event or its associated files. You will need to view the event metadata or the file metadata to see which intelligence provider flagged which criteria.
NOTES – shows the number of user-created notes associated with that event.
STATUS – indicates the status of each event. The event status is the most important part of each event. It is indicated by an icon and is set by either the BluVector Sensor or a user. You can change the event status from this screen. The event status is different from a file status.
The event status can be one of the following:
Trusted (green check mark) – indicates that the event is trusted.
Info (gray circle containing a black “i”) – indicates that the event metadata is provided for information only, and you do not need to adjudicate this event.
Suspicious (orange exclamation mark) – indicates that the event is suspicious.
Malicious (red “X”) – indicates that the event is malicious.
Review (blue flag) – indicates that the event should be reviewed in more detail by an analyst.
By default, events are automatically marked as Suspicious when they are flagged by a BluVector analyzer (for example, if they are above the Machine Learning Engine malicious threshold, match a Yara rule hit, or match a ClamAV signature). You may expand the flagging criteria in the general configuration for analyzers (see Section: Configuring General Analyzer Settings for more information).
Events will be automatically marked as Info if the analysis results do not match any of the flagging criteria.
You may configure the system to automatically set event statuses based on user-defined criteria. For example, you might specify to trust any event from the hostname www.microsoft.com. You can accomplish this from the “Event Workflow Configuration” Screen. See Section: Configuring Event Rules for more details.
For additional information on changing the status of an event or file, see Section: Changing the Status of Events and Files.
ANALYSIS – displays an icon of the filetype, the analyzers that have flagged the content (if any), the name of the file, and a status symbol representing the status of the file. There is usually at least one file associated with each event. An event without associated files typically occurs when the intelligence correlation engine or Suricata matches a network stream that does not contain a file. If an event has more than one file associated with it, a folder icon will appear to the right of the filename.
To view more detailed metadata and analysis of all relevant event metadata, protocol headers, and associated content, select an item under the ANALYSIS column (see Section: Using the Event Details Screen for more information).
Filtering Events
You can filter the events displayed in the Event Viewer through these methods:
Search bar – you may enter a search in the box at the top of the screen to manually query event and file metadata. The search bar contains an autocomplete feature that is consistent with the event schema. You can also save interesting queries. See Section: Searching Events with Queries for more information.
PinPoint – this utility provides a flexible mechanism to identify and drill down on events. To access PinPoint, select Pinpoint in the menu at the top of the screen. The PinPoint sidebar then appears to the left of the events table. For more information about using PinPoint, see Section: Sorting with PinPoint.
Selecting underlined data – You can modify which events are displayed by selecting a field that has a dotted underline (see Section: Using Field Enhancers). A menu will appear with options for searching based on the data.
Customizing the Event Viewer Columns
You can customize some of the ways that the Event Viewer presents data, such as by selecting which columns of information you would like to view and the order in which they appear. You can also add custom columns.
The following procedures describe how to customize the Event Viewer columns.
Procedure: Temporarily Choose the Columns in the Event Viewer
Follow these steps to temporarily change which columns appear in the Event Viewer:
Log in to the ATD GUI (see Section: Logging into the ATD GUI).
Select EVENTS in the menu on the left.
Select EVENT TABLE from the submenu. The Event Viewer appears (see Figure: Event Viewer).
Select Columns, which is located above the table of events. A menu of column options appears.
Select column names to enable or disable them.
To exit this editing mode, select anywhere outside of the menu.
The columns will be reset when you reload the screen.
Procedure: Make Persistent Customizations for the Event Viewer
Follow these steps to make persistent changes to the Event Viewer.
Log in to the ATD GUI (see Section: Logging into the ATD GUI).
From the ATD GUI, select your user name in the upper right corner. A menu appears.
Select Account.
Select Event Viewer. The “Configure Event Viewer” Screen appears (see Figure: Configure Event Viewer Screen).
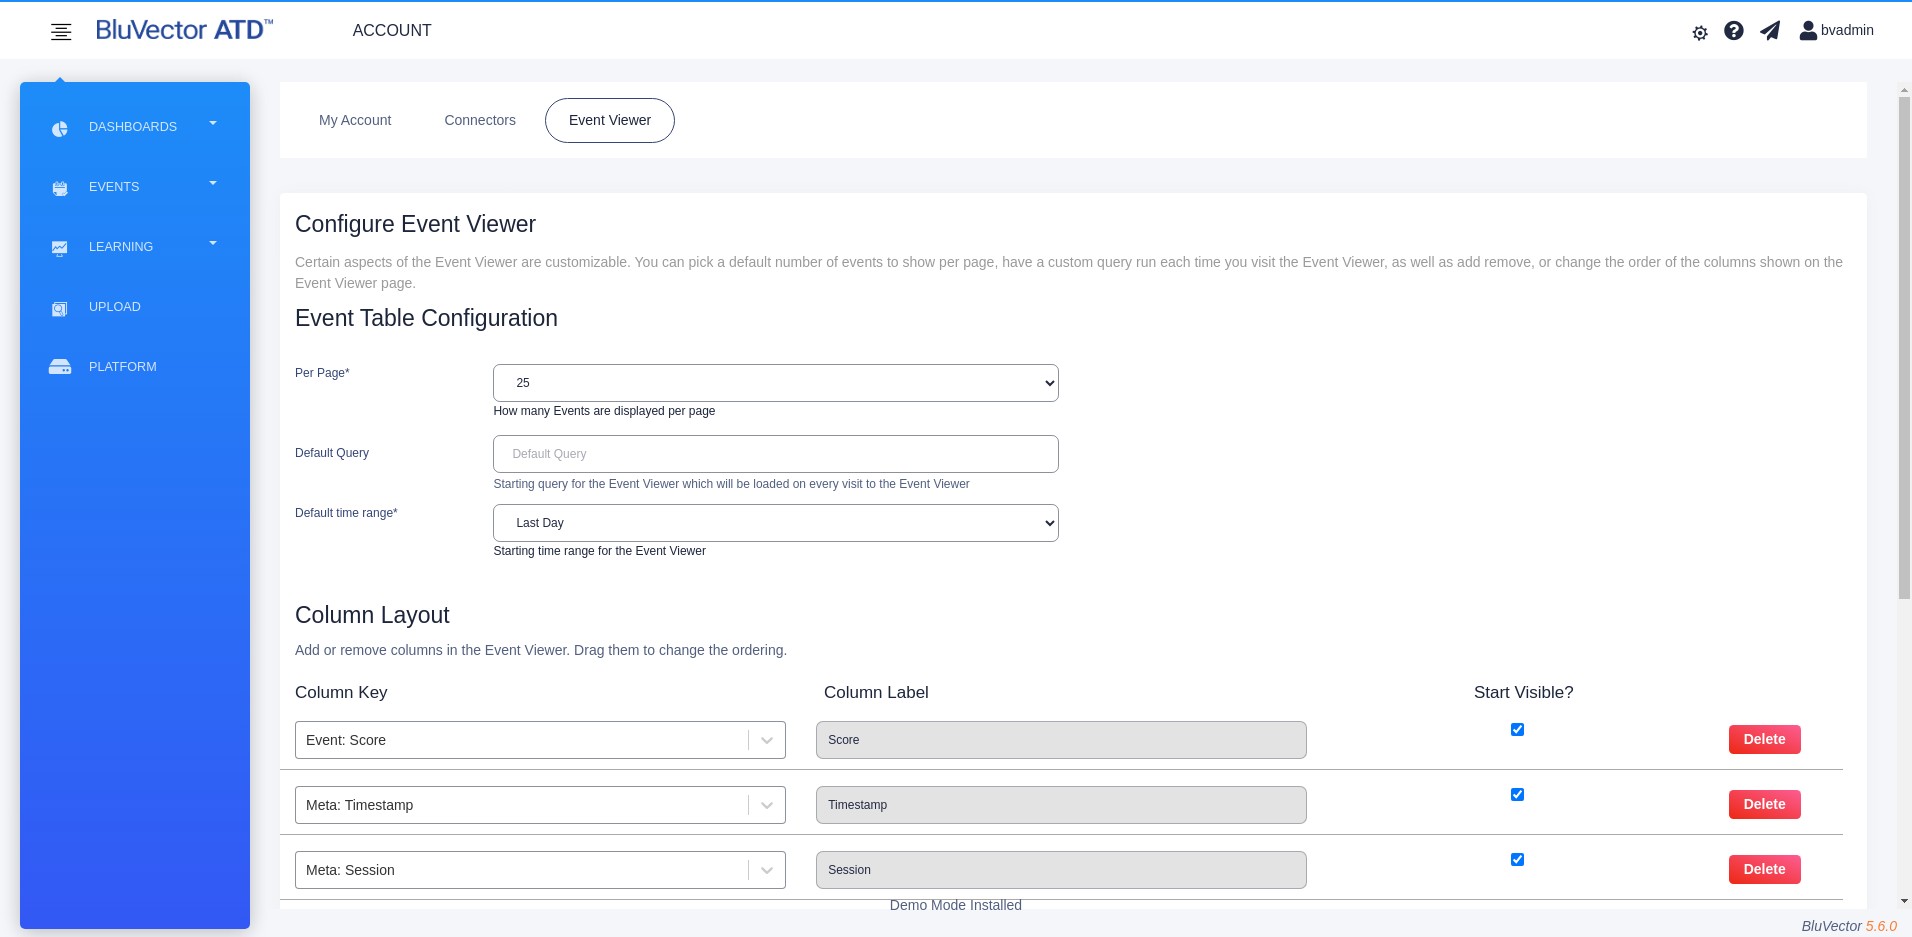
Fig. 17: Configure Event Viewer Screen
To change the number of events that appear at a time on the screen, select an option for Per Page.
To set a default query to be loaded each time you visit the Event Viewer, enter it in the ‘Default Query’ field.
To set a default time period for the Event Viewer, select ‘Default time range’.
You can show, hide, and add columns.
You can reorder the columns by dragging.
You may select the type of data displayed in each column using the dropdown menu associated with each one. You can also type in the field under Column Key to search for the type of data to display.
To add custom data, type the name of the metadata key in a field under Column Key. You can then change the column header for displaying the data by editing the corresponding field under Column Label.
Select Update. The configuration changes become effective. These changes will persist when the Event Viewer is reloaded.
Procedure: Sort the Columns in the Event Viewer
Follow these steps to temporarily change the sorting order in the Event Viewer:
Log in to the ATD GUI (see Section: Logging into the ATD GUI).
Select EVENTS in the menu on the left.
Select EVENT TABLE from the submenu. The Event Viewer appears. (see Figure: Event Viewer).
To change the sorting order of the data in the Event Viewer, select the arrow next to the TIMESTAMP column header. This will sort the events in either ascending or descending order, based when the BluVector Sensor processed the event.
Searching Events with Queries
You can search for events using queries. You may enter the queries into the autocomplete search bar near the top of the Event Viewer to display results in the Event Viewer. The queries can be saved for reuse.
The metadata fields are all lowercase to make queries as easy as possible.
In the schema, each level is indented from the previous level. When you create a query, you will represent the indentation hierarchy with a period separating the levels of key field parameters. For example, files. analysis.hector.confidence starts with files as the first level, followed by a period, and then analysis as a subfield of files, and so on.
The flags key field is particularly important. The strings returned by the flags key identify which analyzer flagged the file, based on the flagging criteria defined for the analyzer (see Section: Configuring BluVector Sensor Analyzers for more information). Any of the flagging criteria can flag the same pieces of content. It is not uncommon to see a list of identifiers in the same flags key.
For a complete list of queryable fields and a description of each, click within the search bar in the Event Viewer. Select Query Syntax Help. A quick reference chart will appear. In this quick reference, the Query Schema and Operations tabs will display information about the schema and how to query for different fields and values. Expand each category to see more information. The references are dynamically generated based on what is currently available in the system. Also see Section: Understanding Data Schemas for more reference information.
The following table provides some example queries that are based on the Python Query Language (PQL) syntax.
Query Name | PQL Query Syntax |
|---|---|
Flagged by analyzer | files.flags!=None |
Hector potentially malicious | files.flags==”hector” |
Password-protected zip archive | files.analysis.extractor.result.msg==”Password protected” |
Hector suspicious PDF | files.flags==”hector” and files.filetype==”pdf” |
Hector suspicious PE32 | files.flags==”hector” and files.filetype==”pe32” |
ClamAV trojan | files.analysis.clamav.result.stream==regex(“Trojan”) |
Intelligence hit | intel!=None or files.intel!=None |
The following sections provide more information about using queries. Also see Section: Changing the Status of Events and Files for how to change the status of events and files after reviewing them.
Viewing Example Queries by Use Case
This section provides examples of how queries can be constructed for specific use cases. Consider that you want to query about a website or a sending mail server hostname:
Query Use Case | Query Example |
|---|---|
Just the hostname | meta.host=="www.acme.com" |
Not the hostname | meta.host!="www.acme.com" |
Using a regex to search for NOT a hostname | meta.host==regex(".*(?<!acme.com)$") |
Suspicious and malicious events with a whitelisted host | status>=2 and meta.host==regex(".*(?<!mcafee. com)$") |
The Not Equal To operator (!=) may not be used in conjunction with a regular expression. Instead, the regular expression itself must handle the exclusion.
Event status may be queried as either a string or as a numeric value. Trusted (0), Info (1), Suspicious (2) and Malicious (3) are available to make it easier to search for events above or below a specific status type by using numeric comparators (>, <, >=, <=).
Here are additional query use case examples:
Query Use Case | Query Example |
|---|---|
Suspicious WordPress content | status=="suspicious" and meta.headers.url==regex("wp-content") |
Ignore specific content-types (for example, SilverLight) | meta.headers.content-type!="application/ x-silverlightapp" and meta.headers.content-type!="x-silverlight-app" |
Files not in a list of particular types | files.ftype not in ["pdf","cdf","ooxml"] |
Ignore common top-level domains (TLD) | meta.host==regex(".*(?!.(com|mil|org|net))$") |
Suspicious files over HTTP where files are not PDF or CDF and not from a common TLD | status=="suspicious" and meta.app == "http" and files.ftype not in ["pdf", "cdf"] and meta.host==regex(".*(?<!.(com|mil|org|net))$") |
Executables over SMTP email | files.analysis.hector.result.filetype== regex("pe32") and status!="trusted" and meta.app=="eml" |
Source IP is one of certain addresses | meta.src in ["84.120.132.174", "95.150.199.54"] |
Entering a Query into the Search Bar
Before you run a query, you may want to filter the events through PinPoint, so that you can query a more select group of events (for more information, see Section: Sorting with PinPoint.)
The following procedure describes how to enter a query into the search bar in the Event Viewer.
Procedure: Query for Events
Follow these steps to enter a query for events:
Navigate to the Event Viewer (see Section: Using the Event Viewer).
Click within the search bar. The Event Queries autocomplete menu appears, which provides suggestions to automatically complete your queries as you type (see Figure: Search Bar with Event Queries Autocomplete Menu). You can also access syntax help and saved queries from this window.
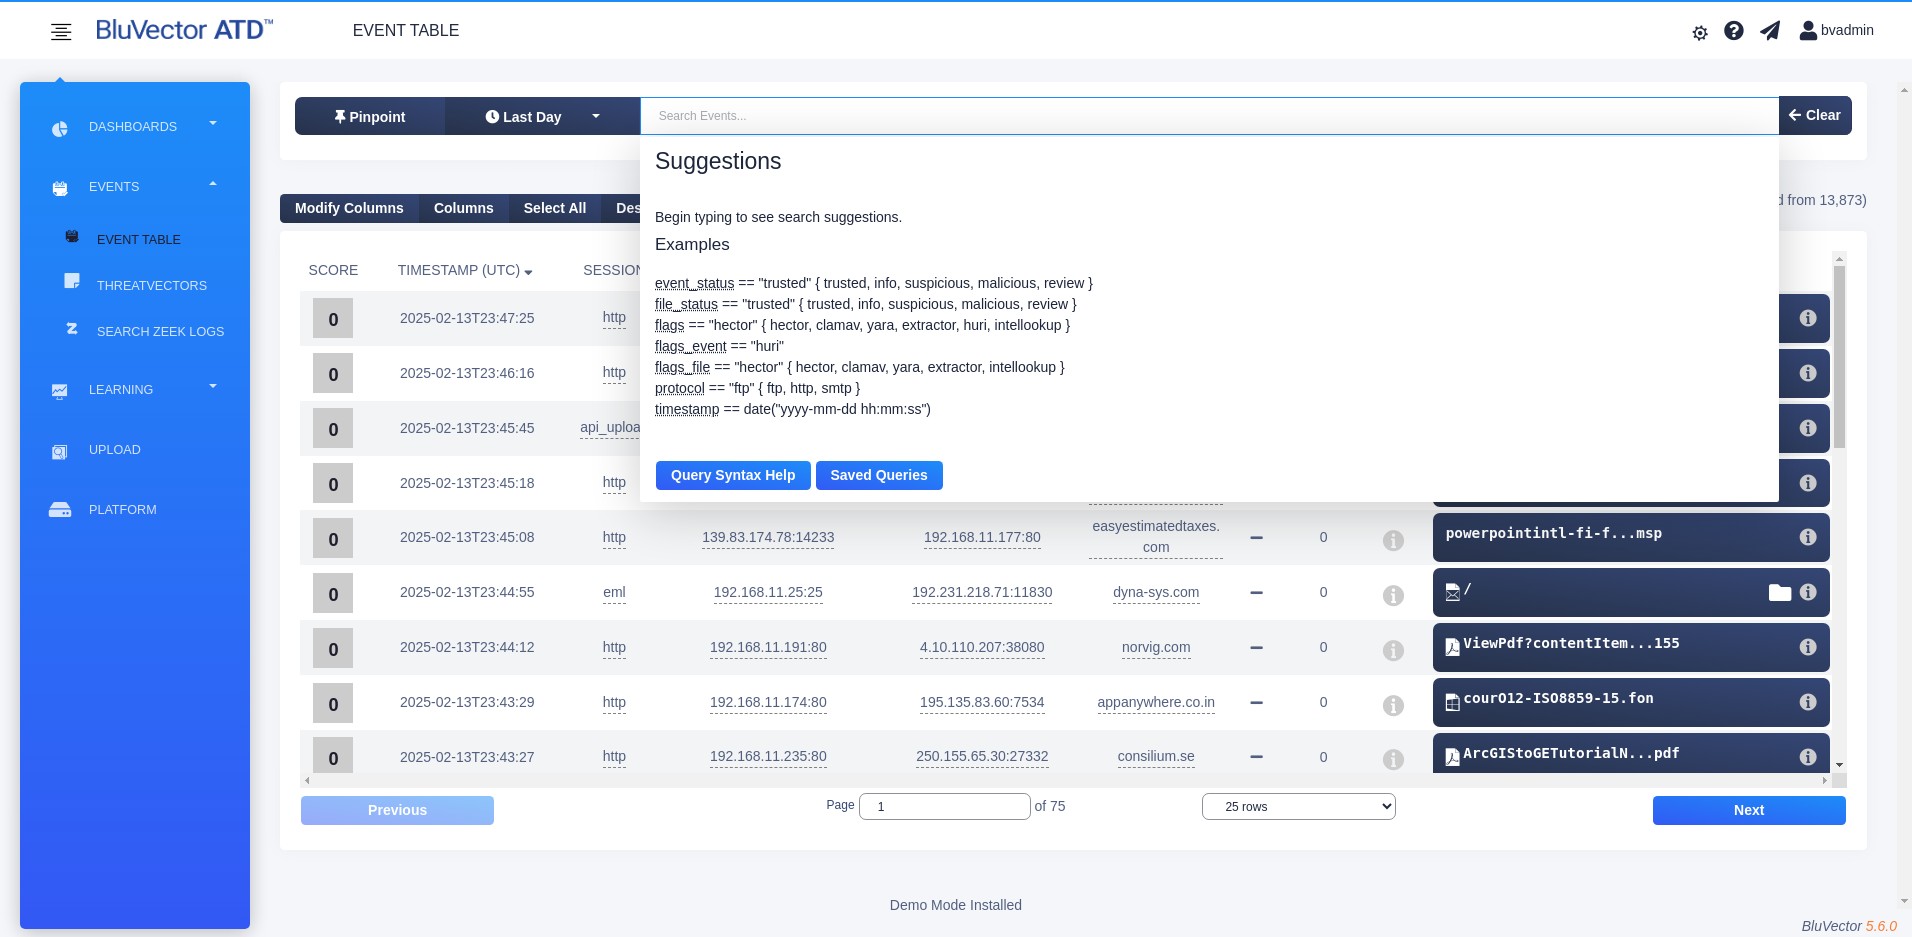
Fig. 18: Search Bar with Event Queries Autocomplete Menu
You can run a query in one of these ways:
You can type a query in the search bar.
You can run a previously saved query.
You can select the underlined information in the Event Viewer and choose from a menu to generate a query. This will open a new Event Viewer and automatically fill in the search bar with the query. For more information about underlined fields, see Section: Using Field Enhancers.
To start a new query, enter the field names into the search bar that you would like to query for, based on the schemas described in Section: Understanding Event Schema.
For example, if you want to search for files with a Suspicious status, enter: files.status == "suspicious".
When you begin typing, the autocomplete menu will suggest possible keys. For certain keys, it will also suggest the values that you can use to complete the query.
You can also refer to the quick reference chart, which appears when you select Query Syntax Help. It provides information about the syntax and which fields you can query. The references are dynamically generated based on what is currently available in the system.
Here are some tips for typing queries in the search bar:
files queries start with “f”; type f for the autocomplete menu to show available queries for the files key.
meta queries start with “m”; type m for the autocomplete menu to show available queries for the meta key.
intel queries start with “i”; type i for the autocomplete menu to show available queries for the intel key.
Queries that are searching for a certain value must have a key followed by two equal signs (==) and the value. If the value is a string, it needs to be inside quotation marks. For example, if you want to search for all events with a Suspicious status, you would type status == "suspicious". The quick reference chart lists which fields have string values rather than Boolean or integer values. If you want to search for all events that did not have a Suspicious status, type an exclamation mark instead of the first equal sign, to denote “does not equal”. For example, the query would be status` != `"suspicious".
Refer to the examples earlier in this section and the examples in Section: Understanding Event Schema.
To run a previously saved query, click within the search bar. Select Saved Queries in the autocomplete menu that appears. A list of saved queries pops up. Select the name of the saved query that you would like to run. The query will automatically populate the Event Viewer with the appropriate events.
To run a query from the information in the Event Viewer, find any underlined information that you would like to search for. This information can come from the Event Viewer rows or the Event Details Screen. Select the underlined information, then select Search for this ..... For example, if an event exists with a source IP address of 123.45.6.78, select that value in the Source IP column of that event and then select Search for this source IP. The Event Viewer will populate with events from that source IP address. For more information about underlined fields, see Section: Using Field Enhancers.
After you have entered the query fields, press Enter on your keyboard to run the query. The query will automatically populate the Event Viewer with the related events.
To clear the information from the search bar, select Clear.
Managing Saved Queries
After you have run a query, you might want to save that particular query so that you can easily use it again later. You also may have a query that you plan to use repeatedly, so you want to be able to access it quickly. You can save a query, and then it will appear in the list of saved queries that can be accessed from the autocomplete menu which appears when you click within the search tab in the Event Viewer.
Before saving a query, it is helpful to test the query by running it, so that you know that it works and will produce the results you are looking for.
The following procedure describes how to save a query for later use.
Procedure: Save a Query
Follow these steps to save a query:
Navigate to the Event Viewer (see Section: Using the Event Viewer).
Click within the search bar. The autocomplete menu appears (see Figure: Search Bar with Event Queries Autocomplete Menu).
You can start saving a query by one of these methods:
If your desired query is already entered in the search bar, select Save Current.
If the search bar is empty and you are ready to create a new saved query:
Select Saved Queries. A list of saved queries pops up.
Select Edit Saved Queries. The “Saved Queries” Screen appears.
Select New Query.
The “Create Saved Query” Screen appears for you to enter the new information.
Enter a name for the query in the ‘Query Name’ field.
The ‘Query’ field might be already filled in (if a query was already entered in the search bar), or it might be blank. If it is blank, enter your query into the Query field.
Select Create to create and save your valid PQL Query. Select Cancel if you decide that you do not want to create the query.
After saving, the “Saved Queries” Screen will appear (see Figure: Saved Queries Screen). It lists all the queries that you have saved.
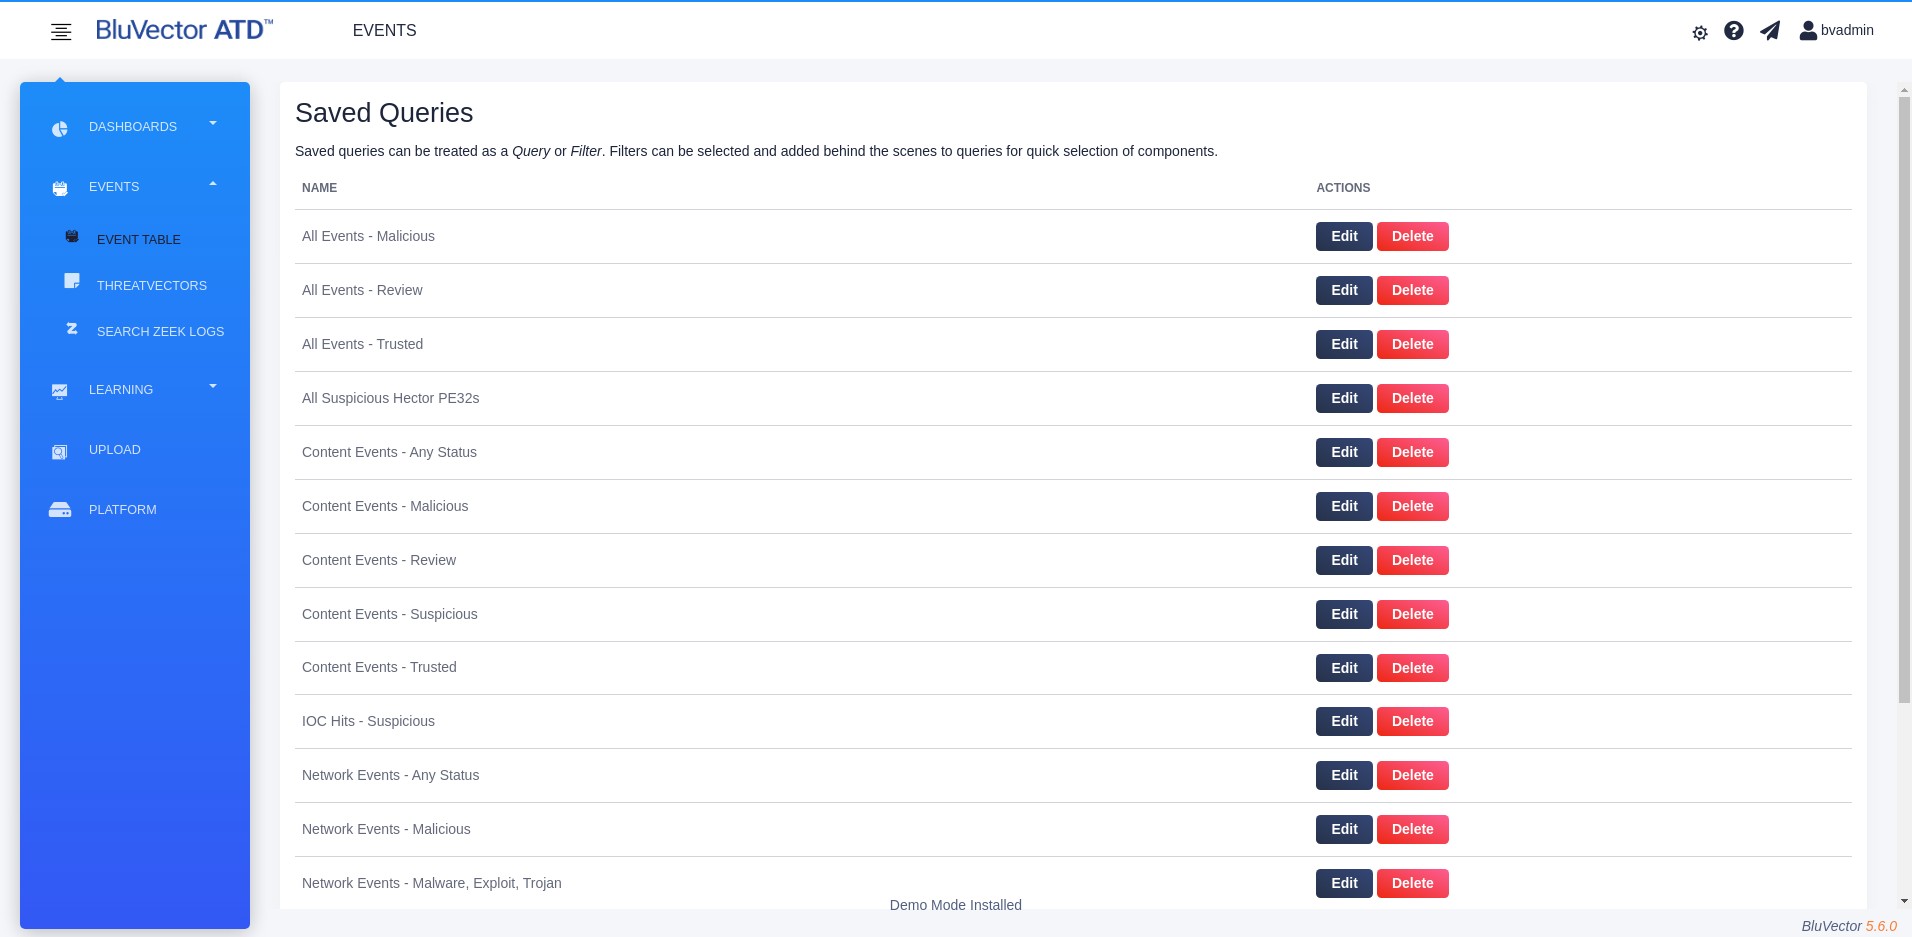
Fig. 19: Saved Queries Screen
9. To create another query, select New Query and repeat the appropriate steps.
The following procedure describes how to edit a saved query.
Procedure: Edit a Saved Query
Follow these steps to make changes to a saved query:
Navigate to the Event Viewer (see Section: Using the Event Viewer).
Click within the search bar. The autocomplete menu appears (see Figure: Search Bar with Event Queries Autocomplete Menu). Select Saved Queries. A list of saved queries pops up.
Select Edit Saved Queries. The “Saved Queries” Screen appears, listing the saved queries (see Figure: Saved Queries Screen).
Select Edit next to the name of the query that you would like to edit. The “Update Saved Query” Screen appears for you to change the information.
Edit the information in any of the fields (see the previous procedure for saving a query for more information about these fields).
When you have finished editing, select Save changes to save your changes, or select Cancel to discard your changes. You will be returned to the “Saved Queries” Screen.
The following procedure describes how to delete a saved query.
Procedure: Delete a Saved Query
Follow these steps to delete a saved query:
Navigate to the Event Viewer (see Section: Using the Event Viewer).
Click within the search bar. The autocomplete menu appears (see Figure: Search Bar with Event Queries Autocomplete Menu). Select Saved Queries. A list of saved queries pops up.
Select Edit Saved Queries. The “Saved Queries” Screen appears, listing the saved queries (see Figure: Saved Queries Screen).
Select Delete next to the name of the query that you would like to delete. The “Delete Saved Query” Screen appears.
You will be asked to confirm whether you want to delete the query. If you are sure that you would like to delete the query, select Delete. You will be returned to the “Saved Queries” Screen, and the name of the query will no longer be listed.
Sorting with PinPoint
The PinPoint tool complements the Event Viewer. It simplifies searching for specific information that would otherwise be challenging to find. PinPoint is especially useful when you must sort through a large dataset to find certain information and to identify anomalies or suspicious network content. For example, you can use PinPoint to filter all but a particular filetype (such as PDF). You can then run a query on just those files to find a particular hostname. Many security analysts prefer using the command-line interface to perform such activities; however, PinPoint provides a faceted search approach allowing analysts to see all available values for the metafield and combine them one at a time.
One of the key fields in PinPoint is Group By. It represents the core feature of PinPoint, because the Group By information helps to narrow the number and types of events that appear. You can add multiple Group By entries to functionally decompose and filter across unique metadata fields. For example, you may want to initially group by protocol, then group by analyzer flags, and then group by host names. If you drill down to the host name level, you can quickly review each of the host names for events over HTTP that were flagged by the Machine Learning Engine.
In the Group By field, you can specify dest, src, meta.dest, and meta.src using CIDR notation to group the results. For example, you could enter dest/8 or meta.src/13. The resulting rows will display the starting IP for each group.
Note:
You can also use CIDR notation in the search bar to filter the events. For example, you can enter dest == "10.0.0.0/8". Also note that although you can use the search bar to query using the ip field with CIDR notation, the ip field is not applicable to the PinPoint feature.
When the search is complete, PinPoint will organize the number of events by their event status (such as Trusted, Info, Suspicious, Malicious, and Review). For example, if you choose Info for Sort By in descending order, your results will show events from all statuses, and will order them according to the attribute that had the most Info events. You can select the plus sign next to an attribute to drill down for more information. You can also select any of the numbers to display those events in the Event Viewer.
You may export the PinPoint results by selecting Export View. The results will be exported in a comma-separated value (.csv) format. Only the expanded rows will be included in the export. You may select Expand All prior to export to get complete results. Because PinPoint is a multi-dimensional analysis tool with multiple drill-down options, the exported results must be flattened to accommodate the .csv format.
The following procedures describe how to use PinPoint to sort information, as well as how to save and load search criteria.
Procedure: Sort Information with PinPoint
Follow these steps to sort information with PinPoint:
Navigate to the Event Viewer (see Section: Using the Event Viewer).
Select Pinpoint. The “PinPoint Query” Screen appears. (see Figure: PinPoint Query Screen).
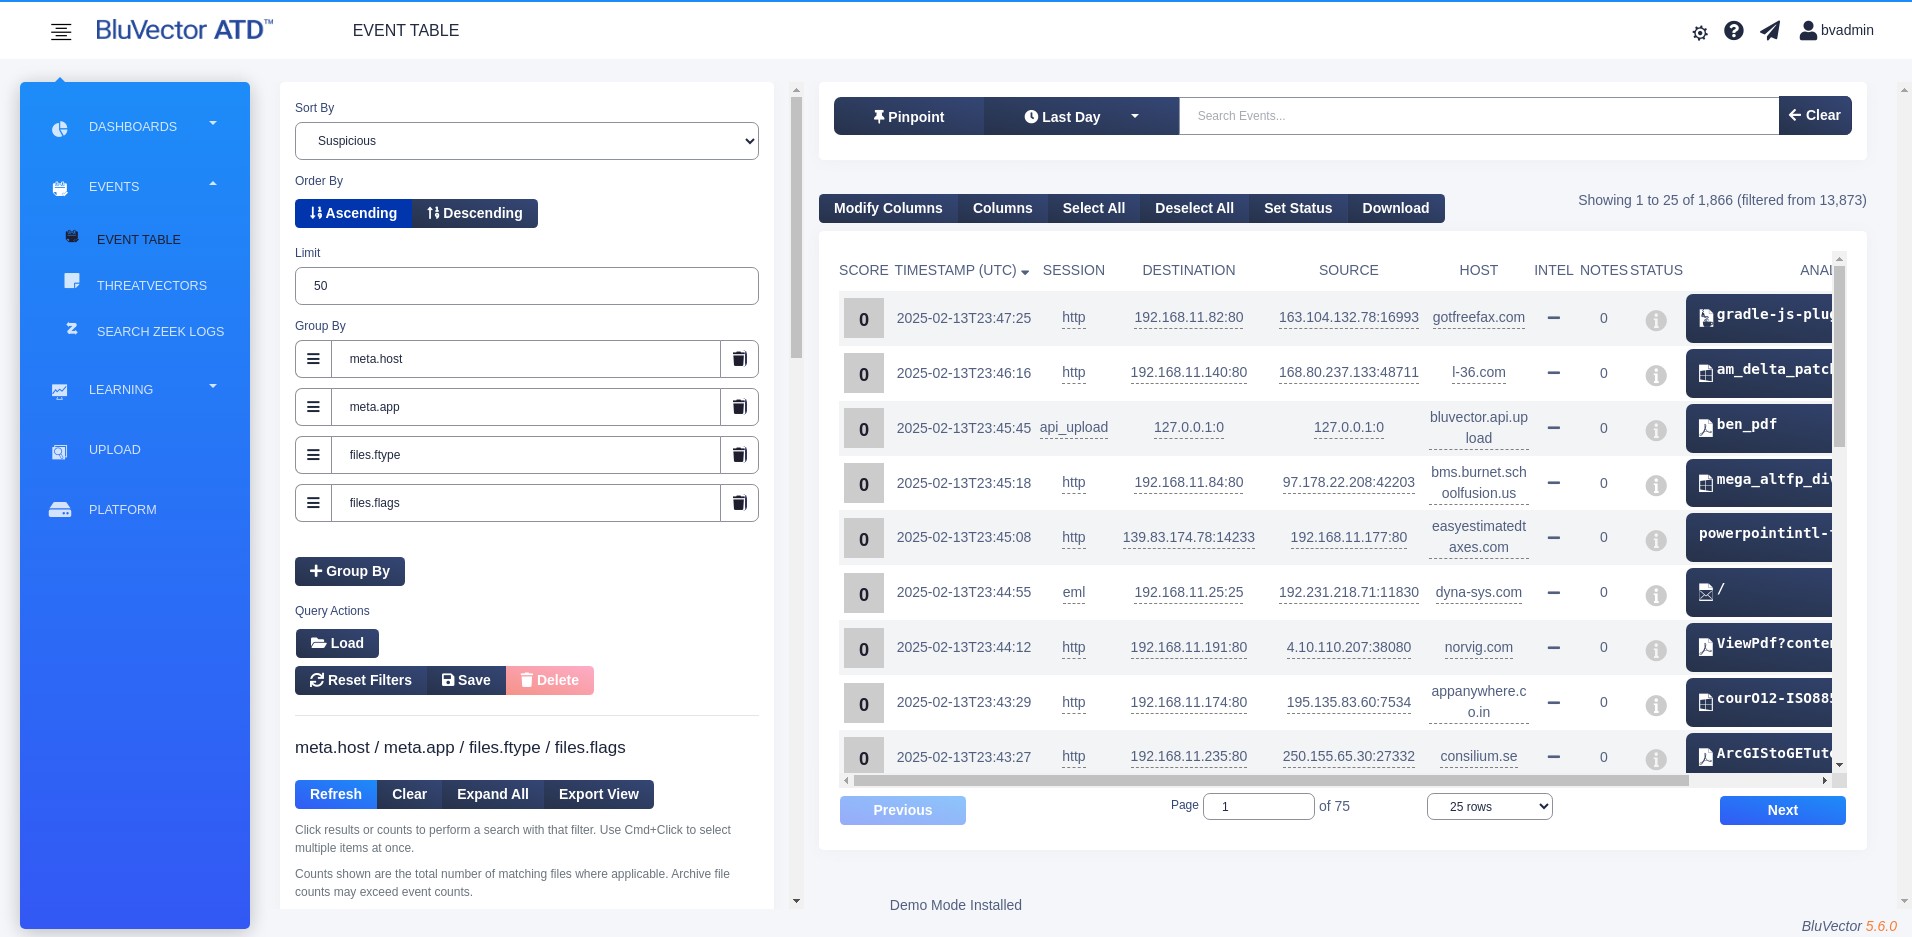
Fig. 20: PinPoint Query Screen
The time frame and query for the PinPoint results can be controlled by search bar entries (see Section: Searching Events with Queries).
From the ‘Sort By’ menu, select which status you would like to use to sort the information.
Select Ascending or Descending for ‘Order By’ to determine whether to view the events in ascending or descending order.
Set a limit to the number of unique items displayed for the first ‘Group By’ field by entering a number for ‘Limit’.
In the ‘Group By’ field, type the attribute by which you want to sort the data. As you start typing, the autocomplete feature will display possible attributes that you could use. See Section: Sorting with PinPoint for more details about the ‘Group By’ field.
For a complete list of queryable fields and a description of each, click within the search bar. Select Query Syntax Help. A quick reference chart will appear. In this quick reference, the Query Schema and Operations tabs will display information about the schema and how to query for different fields and values. Expand each category to see more information. The references are dynamically generated based on what is currently available in the system.
To add additional ‘Group By’ fields, select + Group By and type the appropriate information in the new fields.
To delete a ‘Group By’ field, select the trash can to the right of the field.
You can reorder the ‘Group By’ fields by dragging the left side of the fields.
To run the PinPoint search, select Go. The results will appear below the PinPoint fields, on the left side of the screen.
You can select any of the results to have the tool automatically build your query and display those events in the Event Viewer.
You can select multiple rows in the PinPoint results to filter the results in the Event Viewer. Use the keyboard and mouse sequence for your computer to perform multi-selection. For example, on a Mac computer, use Cmd+Click.
10. To close PinPoint, again select Pinpoint near the search bar.
Procedure: Save a PinPoint Search
Follow these steps to save a set of PinPoint criteria for a later search:
Complete a PinPoint search, as described in the previous procedure.
Select Save.
In the window that appears, type a name for the search you are saving.
Select Create Query.
Procedure: Load a Saved PinPoint Search
Follow these steps to load and run a previously saved PinPoint search:
Navigate to the Event Viewer (see Section: Using the Event Viewer).
Select Pinpoint. The “PinPoint Query” Screen appears. (see Figure: PinPoint Query Screen).
Select Load. A menu appears.
Choose a saved search from the menu. These searches are either default search options or searches that any user has previously saved.
After you select a search, the PinPoint fields will automatically populate.
To run the search, select Go.
Using the Event Details Screen
To view detailed event and file metadata as well as automated correlations, bring up the “Event Details” Screen by following these steps:
Log in to the ATD GUI (see Section: Logging into the ATD GUI).
Select EVENTS in the menu on the left.
Select EVENT TABLE from the submenu. The Event Viewer appears (see Figure: Event Viewer).
Select an item under the ANALYSIS column in the row for the event and files you wish to review. A popup window appears, displaying the “Event Details” Screen (see Figure: Event Details Screen).
 Fig. 21: Event Details Screen
To close the Event Details Screen popup:
Select the X button at the top right of the popup window.
Select the area outside of the popup window.
Press the Esc key.
Note:
If you select the EVENT ID link, the information from this popup view will load into a full screen. This is useful because you can open the link in a new tab in order to view the information at a later time and continue browsing other events. To do this, right-click the link and select Open Link in New Tab. You can also email this link to other analysts if you would like for them to look at the event information in a full screen.
The “Event Details” Screen includes automated correlations to other detection events as well as to network metadata (Zeek logs).
Event correlation is generated when you open the “Event Details” Screen and is effective for events occurring within five minutes of the event being viewed.
Network metadata correlation occurs at the time of the event creation and is effective for a user-configurable time window of up to 15 minutes surrounding the event.
The top of the “Event Details” Screen displays an icon representing the event status, followed by icons for the event analyzers that hit.
Information about the event is displayed in the Event Metadata section on the left side. Details include event ID number, time of the event, source IP/IPv6 and port, destination IP/IPv6 and port, geolocation, host name, and the session (for example, HTTP). Next to the destination and source IP addresses, a flag may appear for the country associated with the event. You can move the mouse cursor over a flag to see the name of the country.
You can select fields that are underlined for more options (see Section: Using Field Enhancers).
You can take further action by selecting from the dropdown options at the top of the screen:
Submit – Select this option to instantly forward the content to already-configured post analyzers, or to go the configuration screen to add more post analyzers. (See Section: Configuring Post Analyzers for more information.)
Connectors – Select this option to navigate to external URLs using the current content metadata. (See Section: Configuring Connectors for more information.)
Download – Select this option to download event and file metadata. (See Section: Downloading Files and Data for more information.)
Set Status – Select this option to change the status of the event, which is distinct from the status of its files. A dropdown menu of the status options appears (see Figure: Changing Status of Event on Event Details Screen). Select the icon and option in the dropdown menu that represents the desired status for marking the event. For additional information on changing the status of an event or file, see Section: Changing the Status of Events and Files.
If there is a Hunt Score, the Hunt Score section shows a breakdown of the event score. Each scoring factor is listed, along with its contribution to the total score.
The Overview section for the event displays details about BluVector analysis performed on the event metadata, such as hURI hostname analysis results.
A graph displays the number of various filetypes seen for this host in the last 30 days for both flagged and unflagged content. You can move the mouse over the graph to see the number of files for a particular filetype within the time period.
Any status changes made to this event will appear in the Status Changes section, listed with the date, the user who made the change, and the change in status.
 Fig. 22: Changing Status of Event on Event Details Screen
Viewing the File Analysis Section
For events that have files associated with them, the File Analysis section provides information about the files.
If the file is an archive, you can select any of the extracted files from the Choose File Content dropdown menu. In the menu, the file status icon is displayed next to the filename, as well as an icon for the tool that flagged the file. After selecting a file, the information for that file will be loaded into the view.
The metadata for the currently selected file is shown. Details include the filename, type, size, as well as the MD5 and SHA256 hashes.
The file Overview section lists which analyzers processed the file and a summary of the results.
You can mark the status for the selected file by selecting the green checkmark for Trusted or the red X for Malicious. For additional information on changing the status of an event or file, see Section: Changing the Status of Events and Files.
The Analysis tab shows expandable results of the file analyzers. Each analyzer that reviewed the file will have its own section of information. For example:
The Yara section will show which rule the file matched, the owner, the namespace, and any tags.
The ClamAV section lists the signature of the file.
The Hector section displays a graph of the Machine Learning Engine confidence level and the threshold for the file.
The NEMA section shows information about any detected shellcode or obfuscated JavaScript.
If the file is an archive and was analyzed by the Extractor Analyzer, the decompressed contents will be listed under Extractor.
The Post Analysis tab shows a summary if any post analyzers are configured (see Section: Configuring Post Analyzers) and their analyses are completed. Post analyzer analyses can take between five seconds to several days to complete. You can expand a section to see more information. Typically, the summary will include the name of the post analyzer, the likelihood of the analyzed content being malicious, and more details of the analysis.
BluVector provides dynamic post analysis using a cloud-based sandbox called BluVector Dynamic Malware Analysis in the Cloud. See Section: Learning about BluVector Dynamic Malware Analysis in the Cloud to learn more about BluVector Dynamic Malware Analysis in the Cloud.
If a threat intelligence provider has flagged the event as being suspicious, then an Intelligence tab will appear. This tab appears only if threat intelligence providers have been configured (see Section: Configuring Threat Intelligence Providers). Intelligence analysis information is available immediately, since the correlation is done on the BluVector Sensor. Select the tab for more detailed information about what the threat intelligence analyzer discovered.
The Hexdump tab shows the raw binary representation of the file, along with an ASCII interpretation of the raw byte sequence. You can choose to see the Head or Tail, and you can download the file for further review.
The Submit to BV tab allows you to send a summary of the event and file content to the BluVector threat intelligence team. You will then receive guidance on the appropriate adjudication for the content.
Viewing the Event Analysis Section
The Event Analysis section contains an Analysis tab. The hURI Analyzer results appear in this tab. It uses machine learning techniques to detect potentially malicious URIs. The hURI row can be expanded to show more information, such as the normalized URL and confidence level. For information on how to configure the hURI Analyzer, see Section: Configuring the hURI Analyzer.
Viewing the Context Section
The Context section provides additional details about how the event relates to other events. The HTTP Headers tab displays relevant network application layer headers, if they are available.
The Correlated Events tab displays a table of the related events, showing the timestamp, event ids, scores, hostnames, and flagging analyzers. To change the time range and matching metadata, select choices in the Search Window Size Around Event dropdown and the Correlate On Having Same dropdown. The table will update to show the new context for this event.
The HTTP Headers Tab provides information about the connection.
Using the Notes Section
You may add a note about this event in the Notes section. The note will apply to the event as a whole. To add a new note, select Add. Notes are viewable by all users.
Changing the Status of Events and Files
In BluVector, events and files have associated statuses that reflect the level of suspicion (see Section: Using the Event Viewer for more information about viewing events, files, and status). As you investigate events and files, you can change their status to reflect what you have found.
Note:
Individual files may have their own statuses, which are distinct from the event status.
If a file status is set to Malicious, its associated event status will automatically change to Malicious, because the event has at least one malicious component. Setting a file status to Trusted does not affect the event status, since malicious events may still contain clean files.
Setting an event status to Malicious does not affect the status of its files, because the files themselves may still be benign. Setting an event status to Trusted changes the file status of all associated files to Trusted as well. That is because an event that is wholly Trusted implies that all files within it are benign as well.
The following procedures describe how to change the status for an event and for a file, as well as for multiple events.
Procedure: Change the Status of an Event
Follow these steps to change the status of an event:
Note:
There is no option to undo a change once you have changed the status of multiple events. You can only change the status back by following the steps in this procedure again. Also, be aware that when you change the status of an event in the Event Viewer, other users will be able to see that the status of the event has changed.
Navigate to the Event Viewer (see Section: Using the Event Viewer).
To change the status of a single event, find the row for that event. Select the icon in the STATUS column. A dropdown menu of status icons then appears. Select the icon in the dropdown menu that represents the desired status for marking the event (for a description of the icons, see Section: Using the Event Viewer). The icon in the event row will eventually change to reflect the new status.
You can also change the status of a single event from the “Event Details” Screen (see Section: Using the Event Details Screen).
To change the status of multiple events at the same time:
Select the rows of the events you would like to change.
Select Set Status in the menu bar above the table of events. A dropdown menu appears (see Figure: Event Status Change Screen).
From the dropdown menu, choose an option beginning with the word Selected that represents the desired status for marking the events. For example, to change the status of the selected events to Review, select Selected Review. The status icons in the selected event rows will eventually change to reflect the new status.

Fig. 23: Event Status Change Screen
To change the status of all the events currently shown on the screen in the Event Viewer:
Select Select All in the menu bar above the table of events. (Note: If you need to deselect all the events, select Deselect All.)
Select Set Status in the same menu bar. A dropdown menu appears (see Figure: Event Status Change Screen).
From the dropdown menu, choose an option beginning with the word Selected that represents the desired status for marking the events. For example, to change the status of the selected events to Suspicious, select Selected Suspicious. The status icons in the selected event rows will eventually change to reflect the new status.
To change the status of all the events that appeared as the result of running a query:
Select Set Status in the menu bar above the table of events. A dropdown menu appears (see Figure: Event Status Change Screen).
From the dropdown menu, choose an option beginning with the word Results that represents the desired status for marking the events. For example, to change the status of all the query results to Suspicious, select Results Suspicious. A window will appear stating how many events your change will impact.
Select Confirm to continue. The status icons of the events in the query will eventually change to reflect the new status.
Procedure: Change the Status of a File
Follow these steps to change the status of a file:
Navigate to the Event Viewer (see Section: Using the Event Viewer).
Select the data in the ANALYSIS column for the desired file. The “Event Details” Screen appears (see Figure: File Details of an Event with Status Change Options).
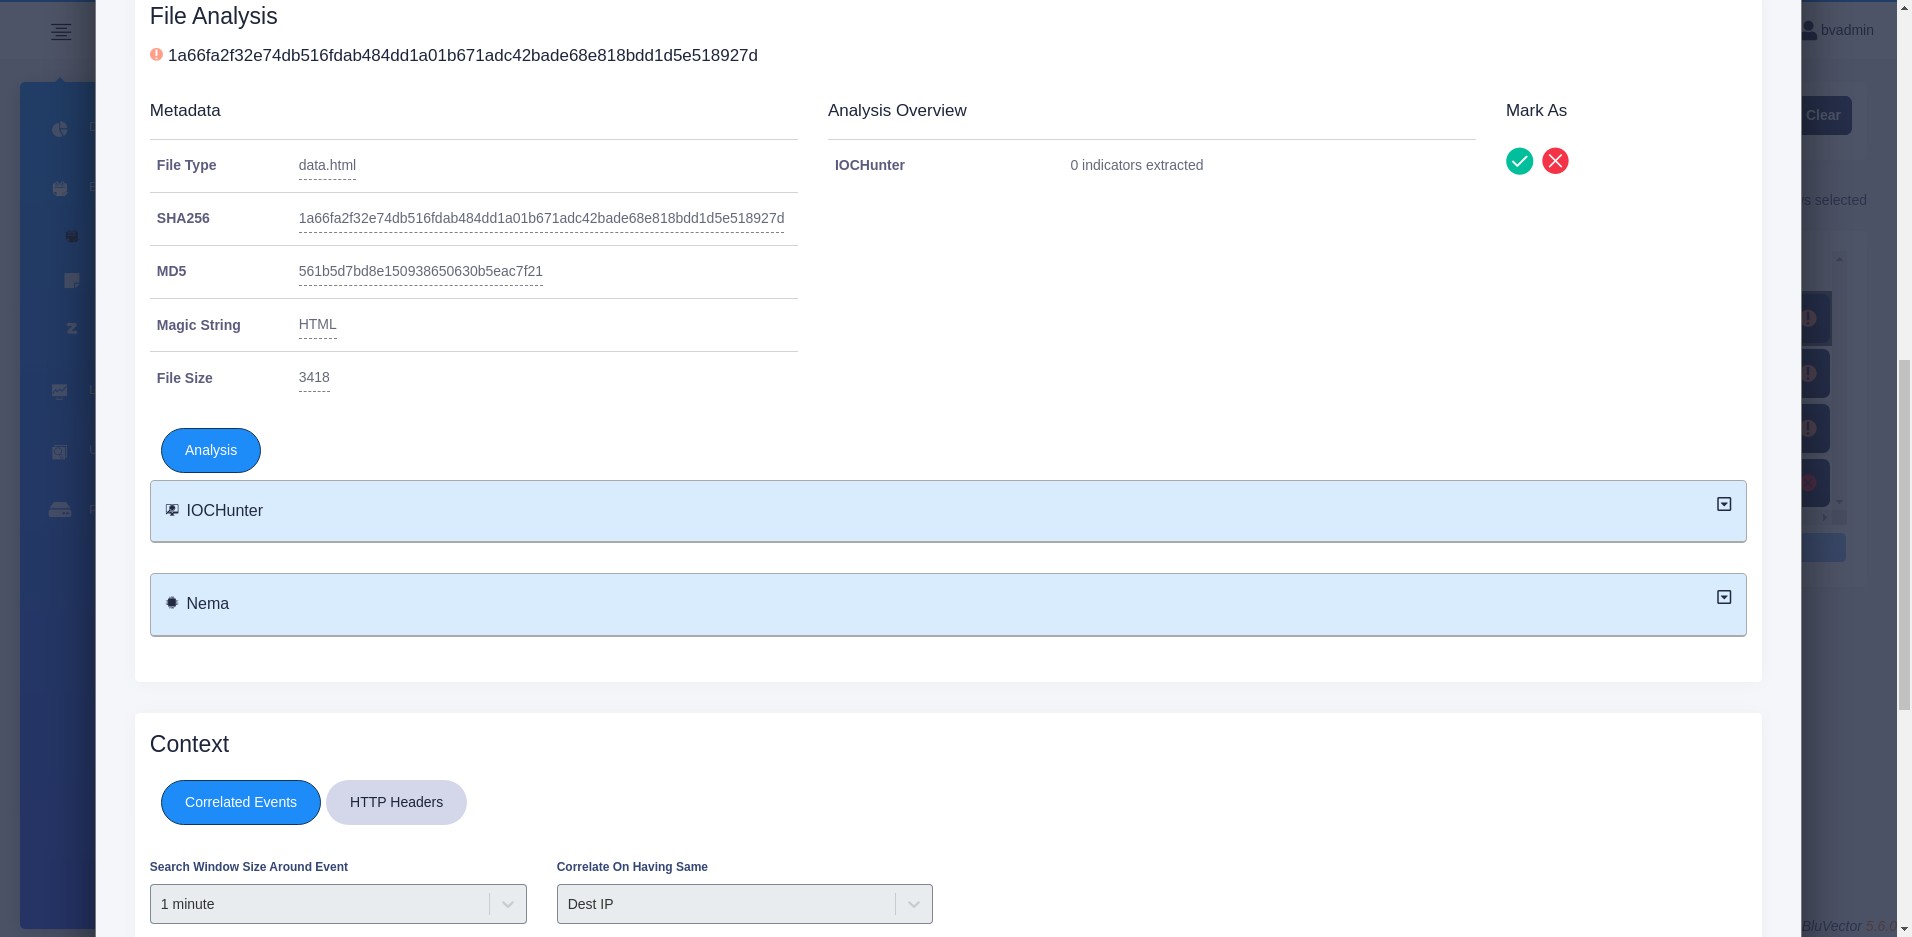
Fig. 24: File Details of an Event with Status Change Options
If the file is in an archive, selected the desired file in the Choose File Content dropdown menu.
Select the green checkmark to mark the file Trusted or select the red X to mark the file Malicious. The icon of the file will eventually change to reflect its new status.
Using Field Enhancers
In many views, you can select a field that has a dotted underline in order to perform additional tasks. A context-driven menu will appear, called a field enhancer. The menu choices will be based on the data in the selected field. Examples of menu choices include:
Searching for all events that have the same data in this field.
Searching for all events with the same combination of data in certain fields for this event.
Adding a workflow based on this data.
Finding all events created from a similar source.
You can find fields with dotted underlines on these screens:
Section: Using the Event Viewer
Section: Using the Event Details Screen
Understanding Data Schemas
BluVector uses a variety of data models, or schemas, to capture information related to network events, files carved from the network and intelligence about potential threats to an enterprise. These schemas are used to form queries and define routing criteria throughout the system.
See the following sections for more information on the various data schemes:
Section: Understanding Event Schema
Section: Understanding Files Schema
Section: Understanding Meta Schema
Section: Understanding Intel Schema
Understanding Event Schema
In order to perform the queries for files or events as described in Section: Viewing Event Information, it is helpful to know how BluVector stores the data. To see a complete list of queryable fields and information, bring up the Event Viewer and click within the search bar (see Figure: Event Viewer). Select Query Syntax Help. A window appears showing a query syntax reference guide. You can select the Query Schema and Operations tabs for information about the schema and how to query for different fields and values. The references are dynamically generated based on what is currently available in the system.
Each event within the Event Viewer contains the first level keys shown below, with values that range depending on the event protocol, event intel hits, number of files associated with the event, and software release version.
Some of the most important first and second level keys are:
{
"_id": { "$oid" : "<unique object identifier>" },
"release": "<release number>", // Dotted BV Release string, i.e "1.5.0"
"status": 0 - 3, // 0 = Trusted, 1 = Info, 2 = Suspicious and 3 =
𝜔→Malicious
"score": <float>,
"meta": { key,value pairs... },
"files": [ {file1}, {file2} ],
"intel": [ {intel1}, {intel2} ],
"analysis": {
"huri": { dict - key, value pairs },
"suricata": { dict - key, value pairs },
}
}
The files key is a list of dictionaries, where each dictionary represents the analysis of one file. There can be several files for one event.
The intel key works similarly, where any number of threat intelligence providers can hit on one event. The intel key is also a list of dictionaries, where the analysis from each intel provider is stored in its own dictionary.
The analysis key displays analysis information generated from analyzers that operate at the event level. The only analyzer that subscribes to events (rather than subscribing to files/content) is hURI. For a full description of BluVector analyzers, see Section: Configuring BluVector Sensor Analyzers.
The meta key is a dictionary containing event metadata (such as IP addresses, hostnames, ports), as well as all of the information provided in the protocol headers.
The release key identifies which version of software was running at the time the event was generated. This ensures consistency between software releases, since the schema may change.
The following table describes certain keys:
Event(s) Key Name | Key Description |
|---|---|
_id | Unique identifier |
release | BluVector release version string in ‘x.x.x’ format |
meta | Metadata dictionary for the event being processed (such as protocol headers) |
files | List of one or more dictionaries containing file analyses |
intel | List of one or more dictionaries containing intelligence analyses |
Understanding Files Schema
As described in Section: Understanding Event Schema, the files list contains complete analysis information for each individual file that is analyzed. The files schema is made up of the following key-value pairs:
"files": [
{
"fname": "<filename string>",
"filetype": "<libmagic filetype description>",
"analysis": {
"yara": { dict - key, value pairs },
"clamav": { dict - key, value pairs },
"hector": { dict - key, value pairs },
"nema": { dict - key, value pairs },
"iochunter": { dict - key, value pairs },
"intellookup": { dict - key, value pairs },
"extractor": { dict - key, value pairs },
"ftype": "<short filetype string>”,
"filesize": <int filesize in bytes>,
"sha256": <sha256 hash string>,
"md5": <md5 hash string>,
"intel": "<intel hits on file metadata>”,
"status": <int representing file status>,
"post_analysis": <int representing post analysis results>,
"flags": [<analyzer(s) that have flagged a file as suspicious>] }
},
{ other file if present .... }
]
The following table describes each of the possible key-value pairs within a file analysis:
File(s) Key Name | Description |
|---|---|
files.fname | File name string |
files.ftype | Short filetype string classification |
files.filetype | Filetype classification from libmagic |
files.filesize | Size of the file in bytes |
files.flags | List of analyzers that have flagged the file |
files.analysis | Dictionary of analysis results for each analyzer |
files.md5 | 128-bit hash of the file |
files.sha256 | 256-bit hash of the file |
The files.analysis key is used in conjunction with each of the analyzers built into the system (for example, files. analysis.hector). The value from each analyzer is a dictionary containing its respective analysis result. For more information, see the following table.
File(s) Analysis Key | Description |
|---|---|
files.analysis | “yara”: { key, value dictionary } |
files.analysis | “clamav”: { key, value dictionary } |
files.analysis | “hector”: { key, value dictionary } |
files.analysis | “nema”: { key, value dictionary } |
files.analysis | “iochunter”: { key, value dictionary } |
files.analysis | “intellookup”: { key, value dictionary } |
files.analysis | “extractor”: { key, value dictionary } |
files.analysis | “huri”: { key, value dictionary } |
The following tables describe the schema for the analyzers in more detail.
The Yara analyzer schema is as follows:
Yara Analyzer Keys | Description |
|---|---|
files.analysis.yara | { key, value dictionary } for Yara |
files.analysis.yara.elapsed_time_ms | An integer representing analysis time in milliseconds |
files.analysis.yara.result.namespace | Source of the yara rules file |
files.analysis.yara.result.rule | Specific rule within the yara rules file that hit on the content |
files.analysis.yara.result.owner | String identifying the owner of the rule |
files.analysis.yara.result.tags | List of identifying Yara rule tag strings |
files.analysis.yara.result.meta | { key, value dictionary } providing additional information |
The ClamAV analyzer schema is as follows:
ClamAV Analyzer Keys | Description |
|---|---|
files.analysis.clamav | { key, value dictionary } for ClamAV |
files.analysis.clamav.elapsed_time_ms | An integer representing analysis time in milliseconds |
files.analysis.clamav.result.stream | String that identifies the signature matching the file |
The Machine Learning Engine analyzer schema is as follows:
Machine Learning Engine Analyzer Keys | Description |
|---|---|
files.analysis.hector | { key, value dictionary } for Hector |
files.analysis.hector.elapsed_time_ms | An integer representing analysis time in milliseconds |
files.analysis.hector.result.confidence | A float value that indicates the confidence level of the analyzed file |
files.analysis.hector.result.threshold | A float value that indicates the threshold confidence level at which the file will be flagged |
files.analysis.hector.result.filetype | String identifying the filetype |
files.analysis.hector.result.parsers | Extensive filetype-specific metadata generated about the file used as features for the machine learning models |
The NEMA Speculative Code Execution Engine analyzer schema is as follows:
NEMA Analyzer Keys | Description |
|---|---|
files.analysis.nema | { key, value dictionary } for NEMA |
files.analysis.nema.elapsed_time_ms | An integer representing analysis time in milliseconds |
files.analysis.nema.result.shellcode | { key, value dictionary } for the shellcode engine |
files.analysis.nema.result.shellcode.info. total_emulated_instructions | An integer value that indicates the total number of emulated instructions |
files.analysis.nema.result.shellcode.info. instruction_chains_found | An integer value that indicates the number of instruction chains found |
files.analysis.nema.result.shellcode.info. heuristic_hits | List of shellcode heuristic hits |
files.analysis.nema.result.shellcode.hits | { key, value dictionary } providing additional information for any heuristic hits |
files.analysis.nema.result.shellcode. num_interesting_chains | An integer value that indicates the number of interesting execution chains detected |
files.analysis.nema.result.shellcode.inter esting_chain_info | List of integer values representing the offset of the interesting execution chains |
files.analysis.nema.result.shellcode.alerts | List of shellcode analysis alerts used for flagging |
files.analysis.nema.result.javascript | { key, value dictionary } for the JavaScript engine |
files.analysis.nema.result.javascript.confid ence | A float value that indicates the confidence level of the analyzed javascript |
files.analysis.nema.result.javascript. threshold | A float value that indicates the threshold confidence level at which the javascript will be flagged |
files.analysis.nema.result.javascript.info. suspicious_string_entropy | A boolean value that indicates if strings are detected with suspicious entropy |
files.analysis.nema.result.javascript.info. js_bad_practices | List of bad practices for non-obfuscated JavaScript |
files.analysis.nema.result.javascript.info. suspicious_variable_names | A boolean value that indicates if suspicious variable names are detected |
files.analysis.nema.result.javascript.info. obfuscated_variable_names | A boolean value that indicates if obfuscated variable names are detected |
files.analysis.nema.result.javascript.info. excessive_variable_updates | A boolean value that indicates if excessive variable updates are detected |
files.analysis.nema.result.javascript.info. obfuscated_url_protocols | List of obfuscated URL protocols |
files.analysis.nema.result.javascript.info. obfuscated_js_bad_practices | List of obfuscated sensitive JavaScript keywords |
files.analysis.nema.result.javascript.info. obfuscated_sensitive_js_keywords | An integer value that indicates the number of obfuscated sensitive JavaScript keywords observed |
files.analysis.nema.result.javascript.info. obfuscated_js_reserved_words | List of obfuscated JavaScript reserved words |
files.analysis.nema.result.javascript.info. eval_count | An integer value that indicates number of times JavaScript eval function is used |
files.analysis.nema.result.javascript.info. string_modification_function_count | An integer value that indicates number of string modification functions used |
files.analysis.nema.result.javascript.info. avg_length_of_strings | A float value that indicates average length of all the strings in JavaScript |
files.analysis.nema.result.javascript.info. max_length_of_strings | An integer value representing length of the largest string in JavaScript |
files.analysis.nema.result.javascript.info. dom_modification_function_count | An integer value that indicates number of DOM modification functions used |
files.analysis.nema.result.javascript.info. CreateObject_ActiveXObject_count | An integer value that indicates number of times CreateObject or ActiveXObject function is used |
files.analysis.nema.result.javascript.info. keyword_count | An integer value that indicates number of times reserved keywords are used |
files.analysis.nema.result.javascript.info. string_having_iframe_count | An integer value that indicates the number of times iframe is present in the strings |
The Extractor analyzer schema is as follows:
Extractor Analyzer Keys | Description |
|---|---|
files.analysis.extractor | { key, value dictionary } for Extractor |
files.analysis.extractor.elapsed_time_ms | An integer representing analysis time in milliseconds |
files.analysis.extractor.result.msg | String that provides miscellaneous information |
files.analysis.extractor.result.files | List containing information about extracted resources (filename and sha256 hash) |
The following files key fields are most useful for querying events, as described in Section: Viewing Event Information:
‘files.analysis.clamav.result.stream’
‘files.analysis.hector.result.confidence’
‘files.analysis.nema.result.shellcode.alerts’
‘files.analysis.nema.result.javascript.confidence’
‘files.analysis.yara.result.owner’
‘files.analysis.yara.result.namespace’
‘files.analysis.yara.result.rule’
‘files.analysis.extractor.result.msg’
‘files.ftype’
‘files.filetype’
‘files.filesize’
‘files.fname’
‘files.sha256’
‘files.md5’
‘files.flags’
Viewing a File Schema Example
The general database schema is currently used for each file, as described in Section: Understanding Event Schema. An example of the schema for a file is shown below.
When performing the queries, it is important to notice the case of the letters in the key-value pairs. The key fields in the schema are all purposely lowercase.
{
"status": 1,
"filesize": 15404,
"filetype": "PE32 executable (console) Intel 80386 (stripped to
𝜔→external PDB),
for MS Windows,
UPX compressed",
"analysis": {
"hector": {
"elapsed_time_ms": 7,
"result": {
"confidence": 0.1470792577469633,
"processing_code": 0,
"filetype": "code.pe32.console",
"bundle": "BUN_20151201_0",
"threshold": 0.5,
"model": "CLS_CON_20151107_0"
}
},
"clamav": {
"elapsed_time_ms": 84,
"result": {
"stream": "None"
}
},
"yara": {
"elapsed_time_ms": 3,
"results": []
}
},
"ftype": "code.pe32.console",
"fuid": "F9xSiEqDF5pEytDHi9",
"_cls": "File",
"fname": "109057237.exe",
"flags": [],
"sha256": "615c22efe236f131a7e8cd74877f35eec29e6c4eee006e5efb38b45e6a5c7ce5
𝜔→",
"md5": "7e2d779f77995eb5620934ac1a0d4cb0"
}
Understanding Meta Schema
The meta key consists of relevant event-based metadata. It also contains all available information from the protocol headers, if applicable. The meta key will return values similar to the following:
"meta": {
"src": <Source Host Name or IP Address string>,
"src_port": <uint16 port number>,
"dest": <Destination Host Name or IP Address string>,
"timestamp": <datetime string>,
"app": <String: application level protocol>,
"headers": { key, value header dictionary }, // Protocol headers.
"host": <Host Name or IP Address string>, ie"xxx.xxx.xxx.xxx",
"dest_port": <uint16 port number>,
"user": <user name string if known>
}
The following table provides a description of each of the possible key-value pairs within the meta key:
Meta Key Name | Description |
|---|---|
meta.app | String representing the application protocol (‘http’, ‘eml’, ‘gui_upload’ or ‘api_upload’) |
meta.collector | Hostname of the system that generated the event. When using an ATD Central Manager, it will be the name of the BluVector Collector that sent the event to the ATD Central Manager. |
meta.dest | String value of the destination IP address |
meta.dest_port | Integer of the destination port |
meta.host | String value of the hostname |
meta.src | String value of the source IP address |
meta.src_port | Integer of the source port |
meta.timestamp | String value of when the event was recorded |
meta.uuid | UUID of the system that generated the event. When using an ATD Central Manager, it will be the name of the BluVector Collector that sent the event to the ATD Central Manager. |
meta.headers | { key, value dictionary } stores protocol-specific metadata, if available |
The following meta key fields can be used to query events as described in Section: Viewing Event Information:
‘meta.app’
‘meta.collector’
‘meta.dest’
‘meta.dest_port’
‘meta.host’
‘meta.src’
‘meta.src_port’
‘meta.timestamp’
‘meta.uuid’
Viewing a Meta Schema Example
The event meta schema identifies the network stream and protocol metadata associated with an event. Here is an example of meta schema captured for an HTTP session.
"meta": {
"timestamp": "2022-01-06T16:15:43.176000",
"dest": "10.12.1.102",
"dest_port": 49192,
"src": "70.39.115.202",
"src_port": 80,
"sfa_elapsed_time_ms": 550,
"host": "huqk.lb590wedo.top",
"uuid": "ab690a4b4d614e279a3bed5e7082b437",
"collector": "lkilberg-s420-38.bah",
"email_body": {},
"in_iface": "",
"event_type": "alert",
"flow_id": 769449546505397,
"transport": "TCP",
"pcap_id": "953b8cbc-6f0b-11ec-b6c9-0242ac11000b",
"pcap_name": "5a125eb6421aa91d02ba78fc-NEMA-huqk.lb590wedo.top.pcap",
"extra_info": "[_PID=16354 _UID=0 _GID=0 _COMM=Suricata-Main
_EXE=/usr/sbin/suricata _CMDLINE=\"/usr/sbin/suricata -l
/var/bluvector/upload/953b8cbc-6f0b-11ec-b6c9-0242ac11000b/suricata -k none -r
/var/bluvector/upload/953b8cbc-6f0b-11ec-b6c9-0242ac11000b/tmp1hx5a333.pcap
--user=0 --group=0 --set outputs.1.eve-log.prefix=PCAPPREFIX:{\\\"pcap_id\\\":
\\\"953b8cbc-6f0b-11ec-b6c9-0242ac11000b\\\", \\\"pcap_name\\\":
\\\"5a125eb6421aa91d02ba78fc-NEMA-huqk.lb590wedo.top.pcap\\\"}# \"]",
"matched_rule_action": "status-info",
"matched_rule_query": "suricata!=None",
"matched_rule_description": "Setting suricata hits to info"
}
Understanding Intel Schema
The intel key is a list of key-value pairs mapping the intelligence providers that hit on event metadata to their respective analysis of that event. The intel key will return values similar to the following:
{
intel : [
'<provider1>': { key, value intel_dict } ,
'<provider2>': { key, value intel_dict }
]}
Downloading Files and Data
After you have examined files and events in the Event Viewer (see Section: Using the Event Viewer) or “Event Details” Screen (see Section: Using the Event Details Screen), you might want to download the raw data about an event, or even the suspicious file itself. You can download event metadata in raw JSON or Microsoft Excel format for archiving, sharing with other analysts, and auditing. You can also download flagged content to a password-protected zip file, to prevent mishandling of the suspicious content until it is decompressed in an appropriate environment. Additionally, you can download any Targeted Logger information that was collected for the event.
Note:
A file will only be available for download if an analyzer flags it as being suspicious. The flagging criteria are critically important because they determine whether or not file content will be saved to disk. (See Section: Configuring BluVector Sensor Analyzers for more information about configuring analyzers.)
For more information about interpreting the raw data schema, see Section: Understanding Data Schemas.
The following procedures describe how to:
Download raw JSON-formatted data
Export metadata to an Excel file
Download the actual suspicious content
Download Targeted Logger information
To begin any of these procedures, first:
Navigate to the Event Viewer (see Section: Using the Event Viewer).
Select the row(s) of the event(s) for which you would like to download the file(s).

Fig. 25: Download Options Menu in the Event Viewer
Continue by following the appropriate procedure below.
Procedure: Download Raw JSON-Formatted Data
Raw event data in JSON format will have a hierarchical structure. Follow these steps to download data about an event in raw JSON format:
Select Download above the table. The Download Options Menu appears (see Figure: Download Options Menu in the Event Viewer).
From the menu, select JSON.
Procedure: Export Metadata to an Excel File
An Excel file with raw data and other information has a linear format. Follow these steps to export metadata to an Excel file:
Select Download above the table. The Download Options Menu appears (see Figure: Download Options Menu in the Event Viewer).
From the menu, select Excel.
Procedure: Download a Suspicious File
Follow these steps to download the actual content for a suspicious file:
Select Download above the table. The Download Options Menu appears (see Figure: Download Options Menu in the Event Viewer).
From the menu, select Event Content.
You will be able to decrypt the zip archive with the password infected. Select OK to continue.
Procedure: Download Targeted Logger Information
Follow these steps to download the data collected by the Targeted Logger:
Select the data in the ANALYSIS column for the event that you wish to review. The “Event Details” Screen appears.
Select Download at the top of the screen. The Download Options Menu for this screen appears. The options are the same as for the previous procedures, with the addition of a Targeted Logger choice if Targeted Logger collections were generated. (Note that the CSV option is equivalent to the Excel option in the previous procedures.)
From the menu, select Targeted Logger. You will receive a zip archive containing the associated log files.
Learning about BluVector Dynamic Malware Analysis in the Cloud
In addition to performing high-speed static analysis of file content, BluVector provides dynamic post analysis using a cloud-based sandbox called BluVector Dynamic Malware Analysis in the Cloud. A sandbox is a specially designed environment that can mimic an operational user host system and trick malware into running as it would on its intended target. Sandboxes are carefully instrumented to capture all of the activity that a malware sample induces into the system. The sandbox then applies a set of heuristics to determine if the sample is benign or malicious.
As part of this process, sandboxes capture key pieces of information about the malicious software, known as indicators of compromise (IoCs). IoCs can be used to identify the malware on endpoints or to identify traffic generated from it. The BluVector Dynamic Malware Analysis in the Cloud system provides context about the content execution of files, with detailed outputs on what the file execution did. This information includes host, network and process information.
Because dynamic analysis can take tens of seconds to over five minutes to complete, it is treated as a post analyzer. The results are available under the Post Analysis tab (see Figure: Dynamic Malware Analysis Results) of the “Event Details” Screen (see Section: Viewing the File Analysis Section).
 Fig. 26: Dynamic Malware Analysis Results
Learning about the Targeted Logger
The Targeted Logger Post Analyzer is a network forensic tool integrated into the BluVector Sensor that automates cyber hunting activities. It leverages the ability of BluVector to evaluate and flag content as an anchor for filtering and correlating network traffic metadata generated by Zeek. This greatly reduces the data set, which an analyst may review to help codify subject matter expertise regarding suspicious traffic patterns. The combination of automated processing with a responsive user interface on the “Event Details” Screen for exploring reduced Zeek logs provides insight into host responses to flagged events (see Section: Viewing the Context Section). This adds value to Zeek log analysis for the analyst. For more options in using Zeek logs, see:
Section: Searching Zeek Logs
Section: Using the REST API
The Targeted Logger keeps a cache of logs that were generated by Zeek. When an event is determined to be suspicious, the Targeted Logger begins scanning this backlog for entries up to 15 minutes before and after the event. It collects entries that match certain criteria, such as host IP and domain, then stores these entries with the event. Depending on the configuration, the collection process can take about 15 to 45 minutes to complete. You can view the logs after the collection period is complete. Please note that you may experience load times up to several seconds for log collections that contain over one thousand entries per log.
Using the Threat Vector Workflow
BluVector provides you with a workspace of multiple views for investigating suspicious network events. You can navigate through these views starting from the Threat Vectors Overview:
The Threat Vectors Overview summarizes the work performed and the work remaining to be done by an analyst (see Section: Viewing the Threat Vectors Overview).
The Threat Vector View contains several components to focus on contextually similar events occurring over a relatively small time frame (see Section: Viewing the Threat Vector View).
The Threat Vector Thumbnails graphically represent the records of a suspicious event-file pair (or just the event if no file is associated to it) (see Section: Understanding Thumbnails).
The Threat Vector Details Screen shows additional details about the event or events and file content that are associated with a thumbnail or thumbnail cluster (see Section: Viewing the Threat Vector Details Screen).
Note:
All dates and timestamps within the ATD GUI are based on the Universal Time Coordinated (UTC) time zone.
Viewing the Threat Vectors Overview
The Threat Vectors Overview displays a table that summarizes the work performed and the work remaining to be done by an analyst. The work consists of suspicious records that are collected into categories called Threat Vectors. This information is also available as a dashboard widget (see Section: Viewing the Threat Vectors Section of the Overview Dashboard).
To bring up the Threat Vectors Overview:
Log into the ATD GUI (see Section: Logging into the ATD GUI).
Select EVENTS from the menu on the left.
Expand the menu, then select THREATVECTORS in the submenu. The Threat Vectors Overview appears (see Figure: Threat Vectors Overview).
 Fig. 27: Threat Vectors Overview
The screen displays an overview of the Threat Vectors. Some examples of Threat Vectors are:
Fileless Malware
Intel Only Hits
Known Bad
Suspicious Web
Suspicious PDFs
Suspicious Emails
Yara Hits
Unmatched Suspicious Events – This is the default Threat Vector for suspicious events that do not match any other Threat Vector.
Threat Vectors are then grouped visually according to configurable group associations. Default group associations include:
Act Now – Contains events requiring immediate review and follow-up.
Investigate – Contains suspicious events that may require additional time to adjudicate and are more likely to contain new and previously unseen threats to the enterprise.
Other – Contains events that fall into the default Unmatched Suspicious Events Threat Vector.
You can expand or collapse a group by selecting the arrow icon next to the group association name. When collapsed, the total number of records per day within the group appears. When expanded, a visualization of the work completion status for each day appears. Selecting the data on any expanded row brings you to the appropriate Threat Vector View (see Section: Viewing the Threat Vector View). The visualization may be switched into any of three display modes by selecting one of the display toggle switches located at the upper left of the table. The display modes are:
Uniform Progress Bar Mode (first option) – This mode shows gray progress bars of equal size. When the screen size is large enough, a number will appear inside the cell showing the count of adjudicated events. As work is completed, the gray bars fill with a teal color. You can view the total number of records needing adjudication and the percent adjudicated by moving the mouse cursor over any of the bars.
Text Only Mode (second option) – This mode shows the number of adjudicated records and number of total records in associated with each cell.
Classic Mode (third option) – This mode shows progress bars of proportional sizes. The size of the bars is relative to the greatest daily number of Threat Vector records in a particular row. For example, a bar that is roughly half the size of the largest bar has roughly half as many records in the collection. This provides an immediate visual indication of which days are producing relatively larger or smaller number of events. As work is completed, the gray bars fill with a teal arrow. You can view the total number of records needing adjudication and the percent adjudicated by moving the mouse cursor over any of the bars.
Viewing the Threat Vector View
The Threat Vector View contains several components to focus on contextually similar events occurring over a relatively small time frame. You can view records in each Threat Vector over the last seven days in 24-hour increments, or for any custom time range. To bring up the Threat Vector View:
Log into the ATD GUI (see Section: Logging into the ATD GUI).
Select EVENTS from the menu on the left.
Expand the menu, then select THREATVECTORS in the submenu. The Threat Vectors Overview appears (see Figure: Threat Vectors Overview).
Select the data on any expanded row. The Threat Vector View appears (see Figure: Threat Vector View).
 Fig. 28: Threat Vector View
The screen displays these components:
The date range that you can select – You can alter the time filter to display a custom time range, all records over the last seven days, or a particular day’s records.
A hierarchical view of metafields – You can investigate the collection based on unique values of the selected metafields in a hierarchical fashion. The PinPoint feature implements this search filter. The drill-down order is defined in the configuration for each Threat Vector. You may select any element in the drill-down to filter the grid of thumbnails to display only the records corresponding to the element selected.
To expand all of the metafields, select Expand All.
To export the information to a .csv file, select Export View.
A method to set the status of one or more records simultaneously. Choose the records you wish to change by selecting either the individual checkboxes or Select All. Choosing Select All only selects thumbnails currently displayed, not all the records in the collection. Select Set Status to change the status. If content is available, the status of the content will be changed; otherwise, the event status will be changed.
A menu option to switch between Threat Vectors – Select Change Threat Vector to display a different Threat Vector. The current time filter will be maintained.
A grid of thumbnails representing each set of records in this Threat Vector for the selected time frame – The thumbnails provide a graphical representation of each record in the collection. If the number of thumbnails exceeds the available screen space, you may scroll to the bottom of the screen to show additional thumbnails. This infinite scroll operates until all thumbnails are in view. Thumbnails are displayed in a configurable order. The order is set according to the associated record’s rank, which is displayed in the lower right corner of the thumbnail. Records with the highest rank are displayed first. A Threat Vector’s rank function and the default Hunt Scoring equation can be set in the “Workflow Configuration” Screen (see Section: Configuring Workflows). See Section: Understanding Thumbnails for more information about thumbnails.
Understanding Thumbnails
A thumbnail graphically represents the record of a suspicious event-file pair (or just the event if no file is associated to it) by visually combining information, such as:
Event information, including protocol and hostnames
Content, including filetype and filename
Analysis information, including flagging analyzers, metafields hitting intel indicators of compromise, and rank
Status, such as Trusted, Suspicious, or Malicious
See Figure: Thumbnail for the anatomy of a thumbnail.
 Fig. 29: Thumbnail
Due to the wide variety of potential combinations of attributes, thumbnails may look significantly different from one another. Additional examples of thumbnails are shown in Figure: Multiple Thumbnails.
The MALICIOUS CLUSTER example in Figure: Multiple Thumbnails shows a thumbnail cluster. Thumbnail clusters represent a set of records that can be adjudicated together (that is, they should have the same status).
 Fig. 30: Multiple Thumbnails
Clusters are created for records that have content with identical SHA256 hashes or identical Suricata signature ids.
The MIXED CLUSTER is a combination of events that have different statuses (for example, the cluster has one event that is Trusted and one that is Malicious).
You can change the status for multiple thumbnails simultaneously by first selecting the thumbnails using the checkbox in their upper right corner and then choosing a new status by selecting Set Status. If you change the status for a thumbnail cluster, then all instances of that content will be set to the new status.
To see more details about the event or events and file content for a thumbnail, click the thumbnail to bring up the “Threat Vector Details” Screen. See Section: Viewing the Threat Vector Details Screen for more information.
Viewing the Threat Vector Details Screen
You can see additional details about the event or events and file content that are associated with a thumbnail or thumbnail cluster. Select a thumbnail or thumbnail cluster to bring up the “Threat Vector Details” Screen (see Figure: Threat Vector Details Screen).
 Fig. 31: Threat Vector Details Screen
When drilling-down into a thumbnail cluster, the event metadata is displayed one at a time and can be paged through using a mechanism at the top right of the screen.
The content of this screen is identical to that shown when drilling-down on events and files in the Event Viewer (see Section: Using the Event Viewer) to bring up the Event and File Viewer (see Section: Using the Event Details Screen). You may change the event or file status within this drill-down view.
Searching Zeek Logs
BluVector generates metadata about every network session observed by the sensor using the Zeek Network Security Monitor (see https://www.zeek.org/ for more information about Zeek). Not every network session results in a BluVector event. The “Search Zeek Logs” Screen provides access to all Zeek data. You can leverage this data to find old network activity that is associated with new indicators of compromise (such as file hashes, domain names, and IP addresses). Additionally, you can investigate activity related to BluVector events beyond that provided by the Targeted Logger.
BluVector executes all Zeek log searches as background tasks. Search tasks will continue to run even if you navigate away from the “Search Zeek Logs” Screen. Search results are saved for two days on the system and can be retrieved from the Search History section of the screen. Search results will be shown per log type in tab-based views.
The following procedure describes how to search Zeek logs.
Procedure: Search Zeek Logs
Follow these steps to search the Zeek logs:
Log into the ATD GUI.
Expand the menu on the left side.
Select EVENTS.
Select SEARCH ZEEK LOGS from the submenu. The “Search Zeek Logs” Screen appears (see Figure: Search Zeek Logs Screen).
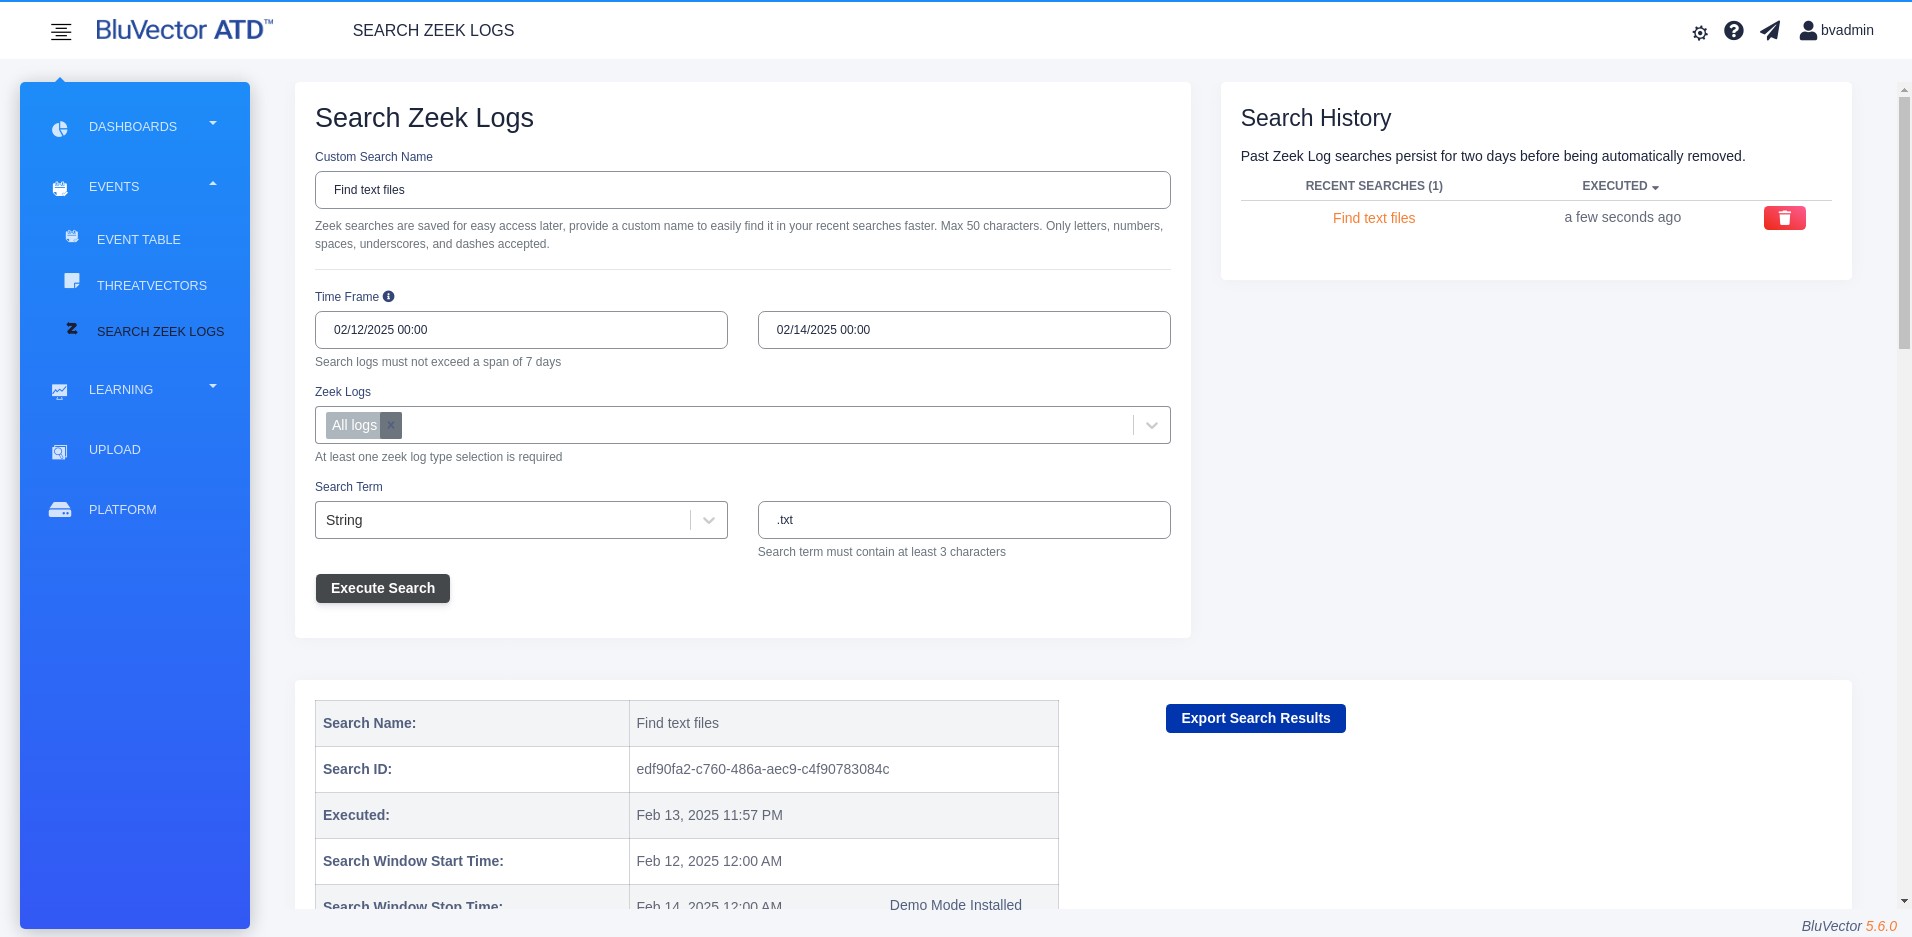
Fig. 32: Search Zeek Logs Screen
Enter a Time Frame for the search. The maximum allowed time range is seven days.
Select one or more log types to include in the search from the Zeek Logs menu. Selecting All logs will include every Zeek log generated by the system, even those not on the commonly used log list presented in the menu.
For the Search Term, select whether to use a String or Regex search.
A string search will look for the character sequence anywhere within a Zeek log record.
A regex search uses the Linux grep extended regex patterns. For more information, see:
Enter a Search Term as either a string or regular expression pattern.
Select Execute Search. A progress bar will show incremental progress on completing the search. Search times may exceed several minutes, depending on search parameters.
To view results of a previously run search, or to see progress on a search that is running in the background, select the search ID in the Search History section.
To delete a search from the history, select the trash can icon next to it.
Evolving Machine Learning Engine Classifiers through On-Premises Learning
Factory default classifiers from the lab are trained on highly diverse datasets and are robust in many environments. However, you can tailor the Machine Learning Engine classifiers to a particular environment. You can realize additional gains by providing supplementary local data.
In particular, training on confirmed local false positives (FPs) and false negatives (FNs) can significantly reduce flagged events.
You can yield significantly different classifiers through even small data additions. While the classifier models are different, they retain the same or better statistical performance. This heterogeneity in classification models significantly complicates the task of malware authors. The authors can no longer rely on testing malware on a generic BluVector Sensor to ensure evasion. Instead, they risk exposure on every deployment of their malware.
The Machine Learning Engine classifiers are retrained using the traffic data observed on a BluVector Sensor. You can start, cancel and manage on-premises retraining jobs from the “Evolve Classifiers” Screen. To reach this screen:
Log into the ATD GUI (see Section: Logging into the ATD GUI).
Select LEARNING from the menu on the left side of the screen.
Select EVOLVE CLASSIFIERS from the submenu that appears. The “Evolve Classifiers” Screen appears (see Figure: Evolve Classifiers Screen).
The “Evolve Classifiers” Screen shows how many classifiers are ready for learning and for deployment, as well as additional details. The classifiers are based on content that is identified within your environment. Once a significant number of files have been reviewed and marked Malicious or Trusted in the Event Viewer or uploaded as Malicious or Benign in the sample library, the ability to initiate training becomes available. The Machine Learning Engine analyzes these files and constructs a new custom classifier that incorporates your data with data previously available from BluVector.
Information about each classifier and the progress toward being able to retrain each classifier is shown in the Classifiers Section.
The number of new total files needed to retrain a classifier appears under FILES FOR RETRAIN (RECOMMENDED).
The column labeled CONFIRMED FOR NEXT RETRAIN (BENIGN/MALICIOUS) displays:
The total number of new files that have been adjudicated and are ready to use in retraining.
The number of these files that are considered benign.
The number of these files that are considered malicious.
 Fig. 33: Evolve Classifiers Screen
The number of new files that need to be adjudicated before being used in retraining is shown in the NEW FLAGGED FILES (UNADJUDICATED) column. These files offer the opportunity to make additional progress by reviewing more events. You have options for how to adjudicate the files, depending on whether you wish to effectively reduce false positives as quickly as possible or whether you wish to maximize the accuracy of future analyses.
Once retraining is completed, classifiers enter an evaluation state. You can then visit the “Evolve Classifiers Deploy” Screen (see Section: Evaluating Retrains on the Deploy New Classifiers Screen) by either selecting Result next to a completed classifier or by selecting DEPLOY from the menu on the left side of the screen. From the “Evolve Classifiers Deploy” Screen, you can review test results and decide to accept or reject the newly created classifier. The Machine Learning Engine makes a recommendation whether to accept or reject the new classifier based on available information, but it is still important to manually evaluate the classifiers on real traffic. For this purpose, the system deploys retrained classifiers in parallel with the existing Machine Learning Engine knowledge.
Both the currently operational and the newly retrained classifiers will observe exactly the same traffic. You are encouraged to review the results after evaluation over a period of hours or days to see exactly how the new classifier would have done, had it been deployed. Ultimately, you must decide to accept or reject the new classifier.
Understanding Centralized Retraining
When operating a BluVector Grid using the ATD Central Manager, classifier retraining occurs only on the ATD Central Manager. Once a new classifier is approved for operational use, BluVector automatically places it into production on all BluVector Collectors that are under the authority of the ATD Central Manager.
Understanding Terminology for Learning
It is useful to define certain terminology when working with the Machine Learning Engine. See the following sections for relevant terms and their definitions:
Section: Understanding Statistics Used to Characterize Datasets and Classifier Performance
Section: Understanding Evolve Classifiers Kickoff Screen File Properties
Section: Understanding Evolve Classifiers Deploy Screen Terminology
Section: Understanding Classifier Artifacts
Understanding Statistics Used to Characterize Datasets and Classifier Performance
False Positive (FP) A file that the Machine Learning Engine flagged, but is truly benign. In other words:
The Machine Learning Engine flagged the file.
The file status is Trusted.
False Negative (FN) A file that the Machine Learning Engine did not flag, but is truly malicious. In other words:
The Machine Learning Engine did not flag the file.
A BluVector analyzer other than the Machine Learning Engine flagged the file.
The file status is Malicious.
Performance Score A decimal score between 0.00-1.00 that quantifies the overall effectiveness of a classifier using the FP and FN rates. A score of 1.00 indicates a perfect score on the test set.
Understanding Evolve Classifiers Kickoff Screen File Properties
Eligible File - A confirmed FP, FN, or file submitted to the Machine Learning Engine Library (observed more recently than the last retrain). Eligible files are also referred to as Confirmed for Next Retrain files.
File Needing Review - A file that might be a FP or FN, pending analyst review (observed more recently than the last retrain). These files are also referred to as New Flagged Files (Unadjudicated).
Required - The minimum number of additional eligible files that must be identified before a retrain may begin. These files are also referred to as Files for Retrain (Recommended). To maintain balance in the training set, it may be necessary to identify eligible files of a particular type (malicious or benign).
Understanding Evolve Classifiers Stages
Ready for Deployment - The stage that a classifier enters after the retraining is complete. The new classifier is now available for evaluation on the “Evolve Classifiers Deploy” Screen (see Section: Evaluating Retrains on the Deploy New Classifiers Screen), which is accessible by selecting Review.
Ready for Learning - The stage that a filetype enters after the required number of files have been obtained. The possible states are:
The classifier is awaiting an analyst’s command to begin the learning process. You may start the learning process by selecting Learn.
The Machine Learning Engine training is still running, and the classifier generation process is not yet complete. An active retraining can be aborted by selecting Cancel. Canceling an active retrain will cause the system to revert back to the state prior to initiating the learning process.
The Machine Learning Engine training failed, and an analyst has not yet selected Reset.
Accumulating Data - The stage of a classifier when it has no active retrain.
Understanding Evolve Classifiers Deploy Screen Terminology
Factory Default Classifier - The latest original classifier shipped from the factory.
Parent Classifier - The classifier being forked for the retrain. On the first retrain, the Parent Classifier is the Factory Default Classifier.
Existing Classifier - The current, operational version of the classifier that is being used to generate events in the system.
Retrained or Candidate Classifier - The classifier resulting from the retrain. It is forked from the Parent Classifier and contains all of the sample data used to train the Parent Classifier, plus additional local data.
Understanding Learning Library Screen Terminology
Sample - An analyst-supplied file or collection of files provided to BluVector within a zip archive. Every file in the collection must share a common Classification.
Classification - An analyst-supplied label to be applied to all files contained in a Sample. It must be either Malicious or Benign.
Understanding Classifier Artifacts
Classifier Bundle - The set of Machine Learning Engine classifiers installed on the system.
Data Bundle - The set of data that is used for training and validation of Machine Learning Engine classifiers during a classifier retrain.
Managing Retrains on the Evolve Classifiers Kickoff Screen
Each Machine Learning Engine filetype has a different classifier associated with it. Retrains are conducted on a filetype basis. Multiple simultaneous retrains are possible, but only one active retrain instance at a time for each filetype is possible. You can see each filetype represented by a tile or row on the “Evolve Classifiers” Screen (see Figure: Evolve Classifiers Screen).
The “Evolve Classifiers” Screen displays sections that correspond to a stage in the learning process. The stages are:
Ready for Deployment - (if any classifiers are ready for deployment, they will be shown in tiles under a heading Ready for Deployment)
Ready for Learning - (if any classifiers are ready for learning, they will be shown in tiles under a heading Ready for Learning)
Accumulating Data - (shown in the Classifiers Section)
As a classifier progresses through the learning process, its tile will appear in the appropriate section of the screen.
Managing the Ready for Deployment and Ready for Learning Stages
Active retrains can be in one of the following states (see Section: Understanding Evolve Classifiers Stages for more information). Here are your possible actions:
Running - The classifier generation process has started, but is not yet complete. A blue progress bar shows the percent of completion (see Figure: Evolve Classifiers Kickoff Screen: Ready for Deployment and Ready for Learning Stages). You can cancel the retrain by selecting Cancel (see the procedure below). If the retrain is canceled, all partial classifier files are deleted. Canceled retrains cannot be resumed. All previously eligible files remain eligible for subsequent retrains.
Completed - The retrained classifier is complete and is currently being evaluated. The classifier tile is now located in the Ready for Deployment section of the screen. A green progress bar displaying 100% completion is shown, along with the date and time of completion. You can select the link to go to the “Evolve Classifiers Deploy” Screen (see Section: Evaluating Retrains on the Deploy New Classifiers Screen).
Failed - An error occurred during the classifier generation process. The failure reason is displayed below the progress bar. You can restore the filetype to the Accumulating Data stage by selecting Reset (see the procedure below).
The following procedures describe how to cancel an active retrain and how to reset a failed retrain. For both procedures, first navigate to the “Evolve Classifiers Kickoff” Screen:
Log in to the ATD GUI (see Section: Logging into the ATD GUI).
Select LEARNING from the menu on the left side of the screen.
Select EVOLVE CLASSIFIERS from the submenu that appears. The “Evolve Classifiers Kickoff” Screen appears (see Figure: Evolve Classifiers Kickoff Screen: Ready for Deployment and Ready for Learning Stages).
 Fig. 34: Evolve Classifiers Kickoff Screen: Ready for Deployment and Ready for Learning Stages
Procedure: Cancel an Active Retrain
Warning:
If canceled, all partial classifier files are deleted. Canceled retrains cannot be resumed. All previously eligible files remain eligible for subsequent retrains, and they will be included in their training set.
Follow these steps to cancel an active retrain:
Navigate to the “Evolve Classifiers Kickoff” Screen as described above. Classifiers that meet the criteria above will show a Cancel button in their tile.
Select Cancel.
Procedure: Reset a Failed Retrain
Follow these steps to reset a failed retrain:
Navigate to the “Evolve Classifiers Kickoff” Screen as described above. Classifiers that meet the criteria above will show a Reset button in their tile. When there is a failed retrain, nothing has changed in the system. The Machine Learning Engine will flag the files the same as always.
Select Reset to clear the failed state.
Managing the Accumulating Data Stage
Classifiers that are in the Accumulating Data stage do not yet have an active retrain associated with them. You can view the number of files that are eligible or that need review. You are encouraged to adjudicate the files. Confirmed FPs or FNs, along with files uploaded to the library, will be considered eligible.
Adjudicating Files for a Retrain
You have choices for how to adjudicate the files that will be used for retraining a classifier:
Method #1: Bulk Trust to Quickly Reduce False Positives Effectively - You can mark all of the eligible new files as Trusted. This is highly effective and can quickly reduce the number of false positives that you may encounter. To use this method:
Select the arrow in the ‘ACTIONS’ column for the classifier you wish to retrain.
Select Trust All New Files.
Select Trust All to automatically adjudicate all of the corresponding files and events as Trusted.
Method #2: Manually Examine and Adjudicate Events for Maximum Accuracy - You can view the eligible new files in the Event Viewer before deciding whether to trust them. This method yields maximum accuracy for future analyses. To use this method:
Select the arrow in the ‘ACTIONS’ column for the classifier you wish to retrain.
Select Trust All New Files.
Select View All New Files. The Event Viewer will be displayed to show the new files. You can then examine files and adjudicate them accordingly.
When the number of eligible files has reached the required number for a retrain, a tile will be promoted to the Ready for Learning stage, at which point a Learn button appears in the tile.
There are often many classifiers in the Accumulating Data stage. You can filter the table by selecting a time range, and you can sort the rows by selecting a column heading.
Starting a Retrain
The following procedure describes how to start a retrain once a classifier is ready for learning.
Procedure: Start a Retrain
Follow these steps to start retraining a classifier:
Log in to the ATD GUI (see Section: Logging into the ATD GUI).
Select LEARNING from the menu on the left side of the screen.
Select EVOLVE CLASSIFIERS from the submenu that appears. The “Evolve Classifiers Kickoff” Screen appears (see Figure: Evolve Classifiers Kickoff Screen: Ready for Deployment and Ready for Learning Stages).
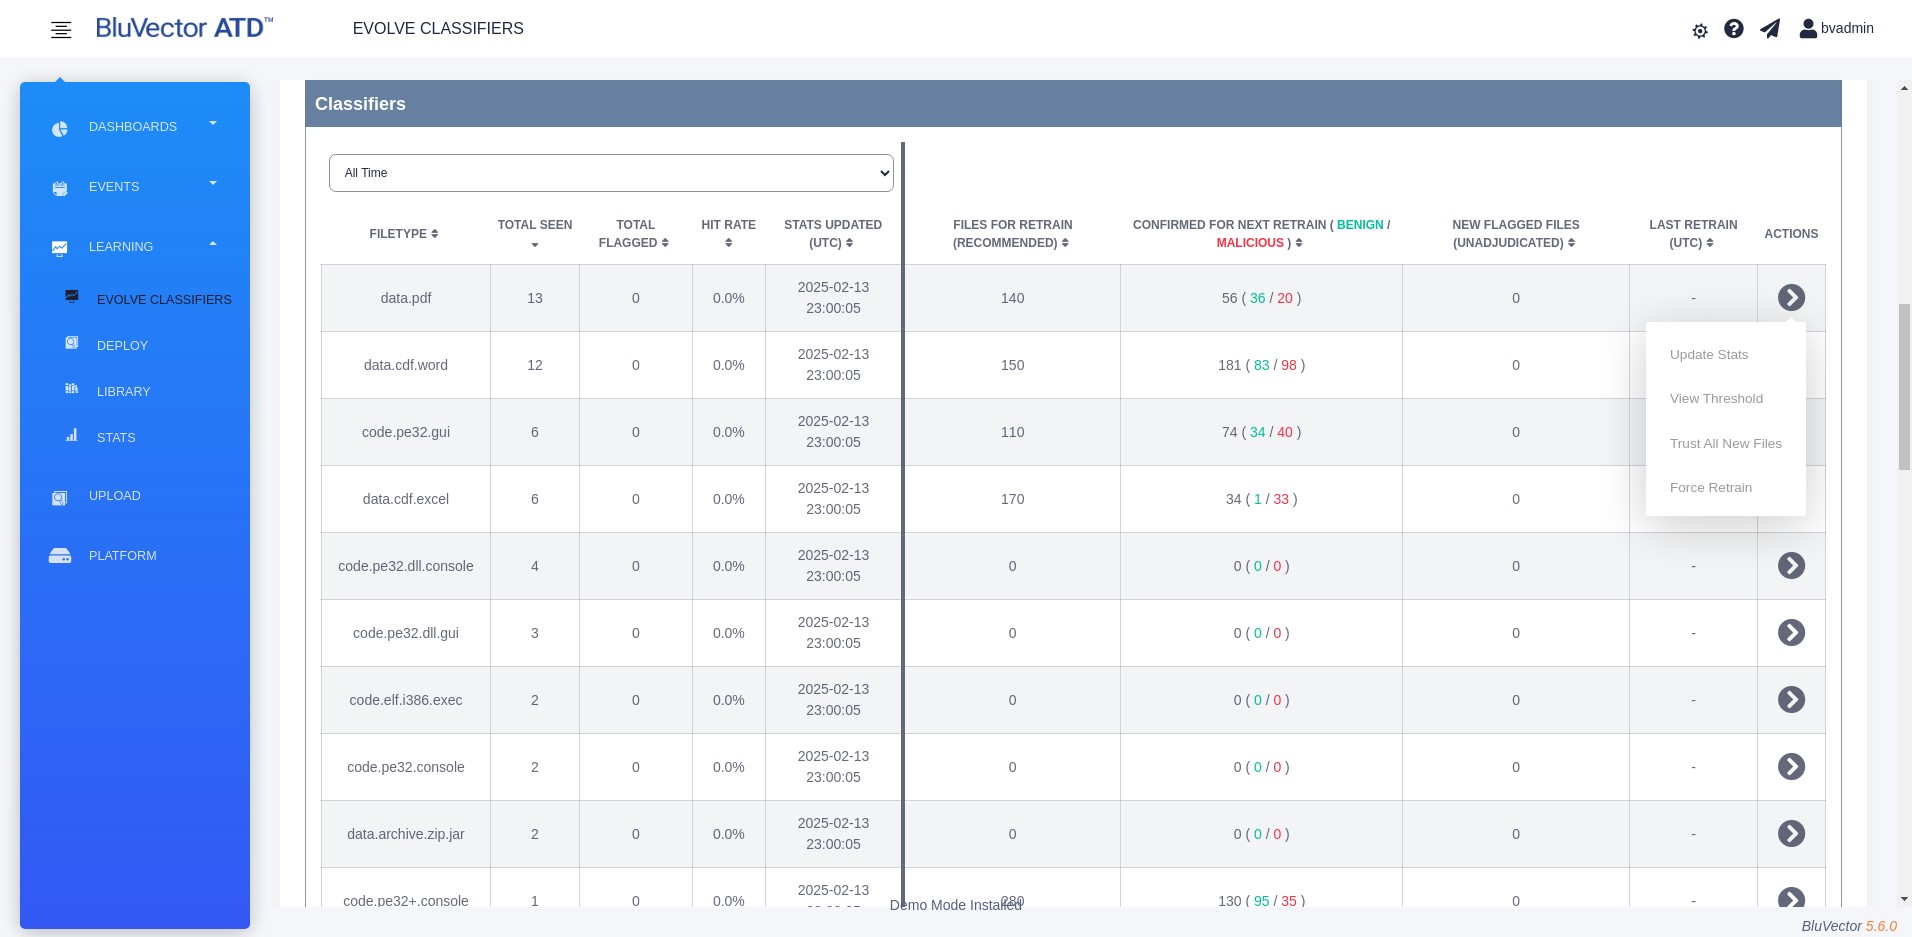
Fig. 35: Evolve Classifiers Kickoff Screen: Accumulating Data Stage
Classifiers that meet the criteria above will show a Learn button in their tile and will be visible in the Ready for Learning section.
Select Learn.
Note:
Retrains typically take between 3-24 hours to complete, depending on the total number of samples and resource availability. However, certain filetypes (for example, PE32 GUI) can take up to 21 days to complete.
Updating Classifier Statistics on the Evolve Classifiers Screen
You can refresh the statistics that appear for a particular classifier on the “Evolve Classifiers” Screen.
Procedure: Refresh Classifier Statistics
Follow these steps to refresh the statistics for a classifier:
From the “Evolve Classifiers” Screen (see Section: Evolving Machine Learning Engine Classifiers through On-Premises Learning), locate the classifier in the table whose statistics you wish to refresh.
Select the arrow button under the ‘ACTIONS’ column.
Select Update Stats. You will be prompted to confirm. This will start the process of updating the statistics for that classifier.
Viewing and Adjusting the Classifier Threshold
You can view and adjust the threshold for a particular classifier from the “Evolve Classifiers” Screen.
Procedure: View and Adjust the Classifier Threshold
Follow these steps to view and adjust the threshold for a classifier:
From the “Evolve Classifiers” Screen (see Section: Evolving Machine Learning Engine Classifiers through On-Premises Learning), locate the classifier in the table whose threshold you wish to view.
Select the arrow button under the ‘ACTIONS’ column.
Select View Threshold. The “Evolve Classifiers Threshold” Screen appears (see Figure: Evolve Classifiers Threshold Screen).
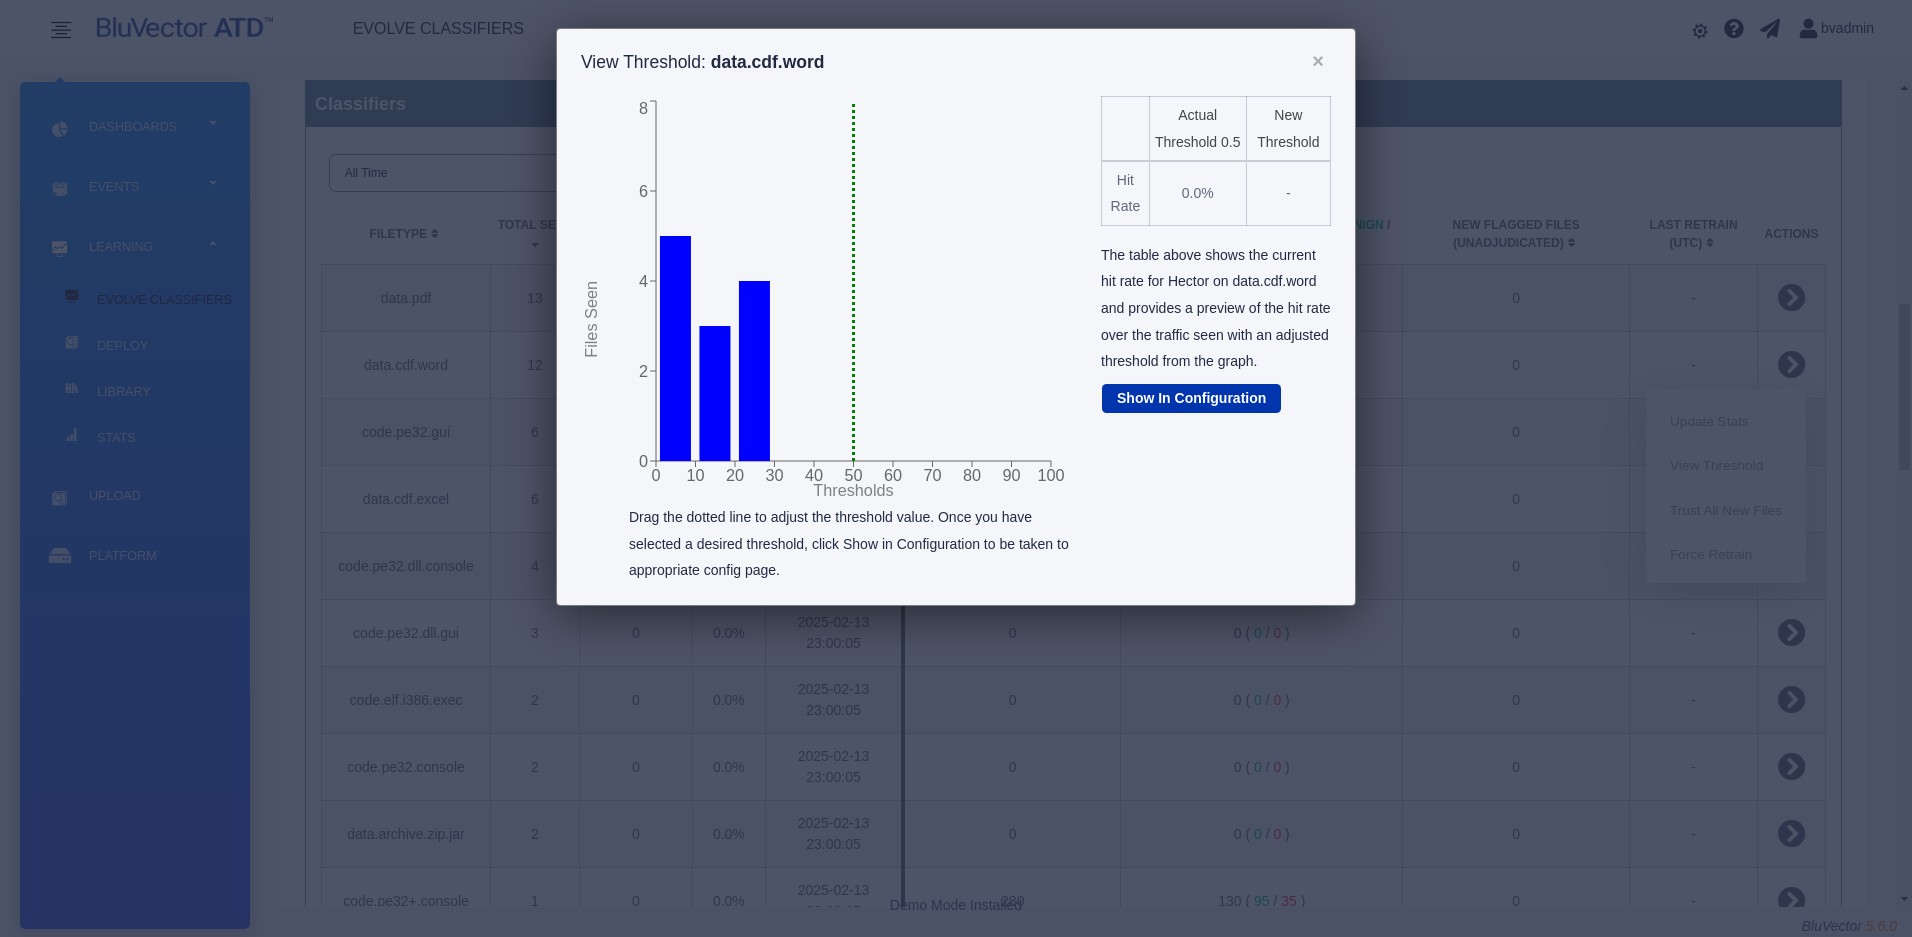
Fig. 36: Evolve Classifiers Threshold Screen
To adjust the threshold value, drag the dotted line.
Select Show in Configuration to navigate to the “Hector Configuration” Screen, where you can configure additional settings (see Section: Configuring the Machine Learning Engine Analyzer for more information).
Forcing a Retrain
You can force a retrain to start before all the recommended files have been made eligible.
Procedure: Force a Retrain
Follow these steps to force a classifier to retrain:
From the “Evolve Classifiers” Screen (see Section: Evolving Machine Learning Engine Classifiers through On-Premises Learning), locate the classifier in the table for which you wish to force a retrain.
Select the arrow button under the ‘ACTIONS’ column.
Select Force Retrain. You will be asked to confirm to retrain.
The retrain process may take awhile. You can safely close the popup window while you are waiting, and the retrain will continue in the background.
Evaluating Retrains on the Deploy New Classifiers Screen
You can evaluate newly retrained classifiers using the “Deploy New Classifiers” Screen. Any classifiers from the Ready for Deployment stage on the “Evolve Classifiers” Screen (see Figure: Evolve Classifiers Screen) will appear on this screen. Only users with administrator privileges and Lead Analysts may access the “Deploy New Classifiers” Screen. To reach the Deploy New Classifiers Screen:
Log in to the ATD GUI (see Section: Logging into the ATD GUI).
Select LEARNING from the menu on the left side of the screen.
Select DEPLOY from the submenu that appears. The “Deploy New Classifiers” Screen appears (see Figure: Deploy New Classifiers Screen).
 Fig. 37: Deploy New Classifiers Screen
Each row represents a completed retrained classifier. The screen displays histograms of Machine Learning Engine confidence scores, which is similar to the “Hector Statistics” Screen (see Figure: Hector Statistics Screen).
The left histogram shows scores issued by the existing, operational classifier (also referred to as the existing classifier).
The right histogram shows scores issued by the candidate classifier.
These histograms cover files that were observed over the network since the completion of the retraining, or for the last 30 days, whichever is shorter. This is described in more detail in Section: Comparing Classifier Test Statistics.
You are strongly encouraged to evaluate the classifiers using a detailed comparison, by selecting Compare. After evaluation, you must select the classifier you would like to use. In the event you wish to undo a classifier selection, you can revert individual classifiers back to their factory default version. You cannot selectively revert to an earlier retrained version, only to factory default versions.
Refer to the following sections for additional information:
Section: Comparing Classifier Test Statistics
Section: Evaluating Recent Traffic as Part of Classifier Retraining
The following procedures describe how to select a classifier for operational use and how to reset classifiers. For both procedures, first navigate to the “Deploy New Classifiers” Screen, as described above.
Procedure: Select Classifiers for Operational Use
Follow these steps to select classifiers to put them into operation:
Navigate to the “Deploy New Classifiers” Screen as described above.
To place all candidate classifiers into operation, select Deploy All Candidates. You will be asked to confirm the request.
To deploy certain candidate classifiers:
Select Compare to see a detailed comparison of the behaviors of the existing classifier and the candidate classifier.
Observe the Machine Learning Engine recommendation regarding which classifier it has determined to be superior by its automated analysis. For more information, see Section: Comparing Classifier Test Statistics and Section: Evaluating Recent Traffic as Part of Classifier Retraining.
If you wish to keep the current classifier, select Keep existing classifier. This will drop the retrained classifier and make all samples used by that classifier ineligible for future retrains. Future retrains will continue to be based off the currently operational classifier.
If you wish to deploy the candidate classifier, select Deploy candidate classifier. This will cause the candidate classifier to replace the existing classifier in the system. Any new files evaluated by the Machine Learning Engine will now use this classifier. Also, any future retrains will use the new classifier as their parent classifier (unless a factory restore or classifier reset is performed).
To view a history of the retrains that have been performed, select Retrain History.
Procedure: Reset Classifiers
Follow these steps to reset classifiers back to their factory default version:
Note:
When resetting a deployed classifier, all other candidate classifiers will be reset to their factory shipped versions.
Navigate to the “Deploy New Classifiers” Screen as described above.
Select Selective Classifier Reset.
Select the check box next to any classifiers you wish to revert to their factory default version.
Select Confirm to continue.
Comparing Classifier Test Statistics
This section explains in detail how to compare classifier test statistics. To view the statistics, bring up the Detailed Classifier Performance Comparison:
Log in to the ATD GUI (see Section: Logging into the ATD GUI).
Select LEARNING from the menu on the left side of the screen.
Select DEPLOY from the submenu that appears. The “Deploy New Classifiers” Screen appears (see Figure: Deploy New Classifiers Screen).
Locate the classifier being compared.
Select Compare. The Detailed Classifier Performance Comparison appears (see Figure: Detailed Classifier Performance Comparison - Test Statistics).
At the top of the screen in the Classifier Test Statistics section, the Overall Performance Score is displayed for the existing classifiers and candidate classifiers. (See Section: Understanding Terminology for Learning for an explanation of terminology.) These scores are determined using the Combined Data test set described below, which is the recommended method of gauging classifier performance on labeled data (samples known to be benign or known to be malicious).
The Machine Learning Engine issues a recommendation based on the higher of these performance scores, which is highlighted in blue. A desirable candidate classifier will have a higher performance score than its parent classifier. In the example shown in Figure: Detailed Classifier Performance Comparison - Test Statistics, the candidate classifier has a score of 0.992, which significantly exceeds that of the existing classifier at 0.969.
Since this performance score is based on a test set that was fixed at retrain time, it remains constant for the duration of the evaluation period (unlike the traffic evaluation statistics, which are described in Section: Evaluating Recent Traffic as Part of Classifier Retraining).
 Fig. 38: Detailed Classifier Performance Comparison - Test Statistics
The Change in Threshold-Dependent Metrics section displays a table of certain classifier performance metrics against verification sample sets. No samples from the verification sample sets were used to train either the existing or candidate classifier. The classifier performance metrics are:
Change in False Positives
Change in False Negatives
Change in Performance Score
The verification sample sets are:
Original Test Data - The original test set used to evaluate the factory default version of the classifier.
Local Traffic Holdout Data - Files that were reserved for testing. Of all eligible files at the start of the retrain, only 80% are used to retrain the classifier; the remaining 20% constitute this test set.
Combined Data - A concatenation of the above test sets. Usually, the Local Traffic Holdout Set constitutes approximately 1-10% of this dataset.
Up and down arrows in the table indicate if the metric is higher or lower in the candidate classifier, relative to the existing classifier. Depending on the performance metric, improvement may be indicated by either a higher or lower value. However, the color always corresponds to whether the change is desirable. Improvements are displayed in green, while regressions are displayed in red.
The Change in False Positives and Change in False Negatives rates are represented as percentages, and the Change in Performance Score is represented as a decimal number. If insufficient data exists to produce a statistically meaningful result, a warning triangle appears with a tooltip explaining the issue.
The displayed quantities are absolute changes in the metric, not percent change. For example, if the False Positives (FP) for the existing classifier is 0.020 (2.0%) and the FP for the candidate classifier is 0.010 (1.0%), then the value displayed would be 1.0% with a down arrow highlighted in green, not -50%.
Each of these quantities is dependent on a threshold. For example, the Machine Learning Engine will flag significantly more files at a threshold of 10 than at 90. The False Positive percentage will increase significantly at a lower threshold, while the False Negative percentage will decrease significantly. You can compare the test statistics using independent thresholds on the existing classifier and candidate classifier, using the sliders above the table. Recommended settings that give a near-maximum Performance Score are shown for each classifier.
A desirable candidate classifier will show an increase in Performance Score. It is expected that the retrained classifier may perform slightly worse on the Original Test Data set, as it is being tailored away from the factory environment toward its network environment. A large reduction in FP is expected on the Local Traffic Holdout Data set, accompanied by a notable improvement in Performance Score on that set. The Combined Data set is expected to show tempered performance in all metrics, as it is a combination of the previous two test sets.
A desirable candidate classifier will have recommended thresholds between 40 and 60 and typically near 50. Recommended thresholds that are above 65 or below 35 are cause for concern and may indicate a poor dataset.
The following procedure describes how to evaluate threshold-dependent metrics.
Procedure: Evaluate Threshold-Dependent Metrics
Follow these steps to evaluate metrics that depend on a threshold:
Navigate to the Detailed Classifier Performance Comparison as described above (see Figure: Detailed Classifier Performance Comparison - Test Statistics).
Independently adjust the slider bars to see how the classifiers perform against each other on the datasets, using particular threshold settings.
To restore the recommended threshold settings, select Set to Recommended Thresholds.
Note:
These slider bars do NOT affect system configuration. If the candidate classifier is later deployed, the recommended threshold is used. It can be changed later in the configuration screen described in Section: Configuring the Machine Learning Engine Analyzer.
Evaluating Recent Traffic as Part of Classifier Retraining
This section explains how to compare a candidate classifier to an existing classifier based on recent network traffic. The evaluation is displayed on the Detailed Classifier Performance Comparison. To bring up the screen:
Log in to the ATD GUI (see Section: Logging into the ATD GUI).
Select LEARNING from the menu on the left side of the screen.
Select DEPLOY from the submenu that appears. The “Deploy New Classifiers” Screen appears (see Figure: Deploy New Classifiers Screen).
Locate the classifier being compared.
Select Compare. The Detailed Classifier Performance Comparison appears.
Scroll down to the Evaluation on Recent Traffic section (see Figure: Detailed Classifier Performance Comparison - Recent Traffic).
The candidate classifier and existing classifier are both subjected to all traffic seen on the BluVector Sensor, so that you can see how the candidate classifier would have done if it were deployed. In the Evaluation on Recent Traffic section of the screen, the results are dynamic and change with observed traffic. Ideally, you would evaluate the candidate classifier for a period of roughly three to seven days using representative traffic (depending on volume). After that time, you may make an informed decision to accept or reject the candidate classifier.
The recent traffic data is presented in two formats on the screen:
The Change in File Classification plot at the top of the screen (see Figure: Detailed Classifier Performance Comparison - Recent Traffic) shows how the existing and candidate classifiers can “disagree” in their flagging. The two arrows show the number of files with a change in classification (the files changed from Benign to Malicious or from Malicious to Benign).
On a typical network, an analyst would expect to see that the vast majority of traffic (>90%) maintains the same classification. You may wish to examine the individual events that changed from Malicious to Benign. This is the portion of traffic that the existing classifier flagged as Malicious that the candidate classifier would not have flagged. After selecting this arrow, you would hope to see many truly Benign events which the existing classifier mistakenly declared Malicious, while the candidate classifier correctly declares them Benign. Analysts on a typical enterprise network would also expect to see a larger number of
 Fig. 39: Detailed Classifier Performance Comparison - Recent Traffic
events changing from Malicious to Benign than changing from Benign to Malicious. This would represent an overall reduction in false positives.
The Confidence Histogram Comparison plot at the bottom of the screen (see Figure: Detailed Classifier Performance Comparison - Recent Traffic) shows the distribution of Machine Learning Engine Confidence scores in the same format as shown on the “Hector Statistics” Screen (see Figure: Hector Statistics Screen). Statistics are shown for all traffic, including SMTP and HTTP. The time period is from the present time back to the time of retrain completion, up to a maximum of one month. If the retrain was completed over one month ago, a sliding window dating back one month from the present is used.
You can estimate classifier performance and analyst workload by the shape of these histograms. Desirable classifier performance on a typical network has these features:
A large number of low-scoring files
A few high-scoring files (confident in malware)
A generally decreasing number of files moving from left to right on the plot
This reflects the expected distribution of Benign versus Malicious traffic on the network, as well as the desire that files that are declared either Benign or Malicious confidently.
Numerous files with scores ranging from 30-70 are ambiguous and can increase analyst workload.
Examples of generally desirable and undesirable histogram shapes are shown in Figure: Examples of Good and Bad Performance Histograms.
The results of retraining are visible in the histograms:
When training on false positives, a desirable candidate classifier will show a lower net frequency of files over the classifier threshold (shown with red bars).
A desirable candidate classifier might even show a general shift of files declared Benign towards the left. In other words, files declared Benign are declared more confidently.
The classifier recommended by the Machine Learning Engine is again highlighted at the bottom of the screen. This recommendation is the same as the one made at the top of the screen in the Classifier Test Statistics section (see Section: Comparing Classifier Test Statistics). The recommendation is not based on the histograms.
 Fig. 40: Examples of Good and Bad Performance Histograms
Managing the Machine Learning Engine Library
The Machine Learning Engine Library manages both user-submitted files and automatically collected files that are useful for on-premises learning.
You are highly encouraged to upload private collections of malware that have been curated over time within the enterprise or from shared collections. Additionally, collections of enterprise-specific benign software that transitions the BluVector Sensor are good candidates for manual inclusion in the library, as this will reduce the likelihood of the system generating a false positive on these files.
In addition to user-submitted files, the library automatically collects files based on analyst adjudication of events. On an ATD Central Manager, the library will collect information about adjudicated files from all joined BluVector Sensors. As you change the status of a file, the Machine Learning Engine recognizes opportunities to learn and improve (false positives and false negatives). These files are taken from the live traffic being monitored by the system.
You may manually reset individual filetypes stored within the library. Upon reset, all files of the selected filetypes will be irrevocably lost. To retrain classifiers of a filetype that was reset, the system must accumulate a new set of file samples.
The following procedures describe how to manually upload files to the library, as well as how to delete a filetype.
Procedure: Manually Upload a Sample File to the Library
Follow these steps to manually upload a new sample file to the Machine Learning Engine Library:
Identify file samples to include in the on-premises learning.
Divide the file set into a malicious group and a benign group.
Create a zip archive for each group.
Select LEARNING from the menu on the left side of the screen.
Select LIBRARY from the submenu that appears. The “Learning Library” Screen appears (see Figure: Learning Library Screen).
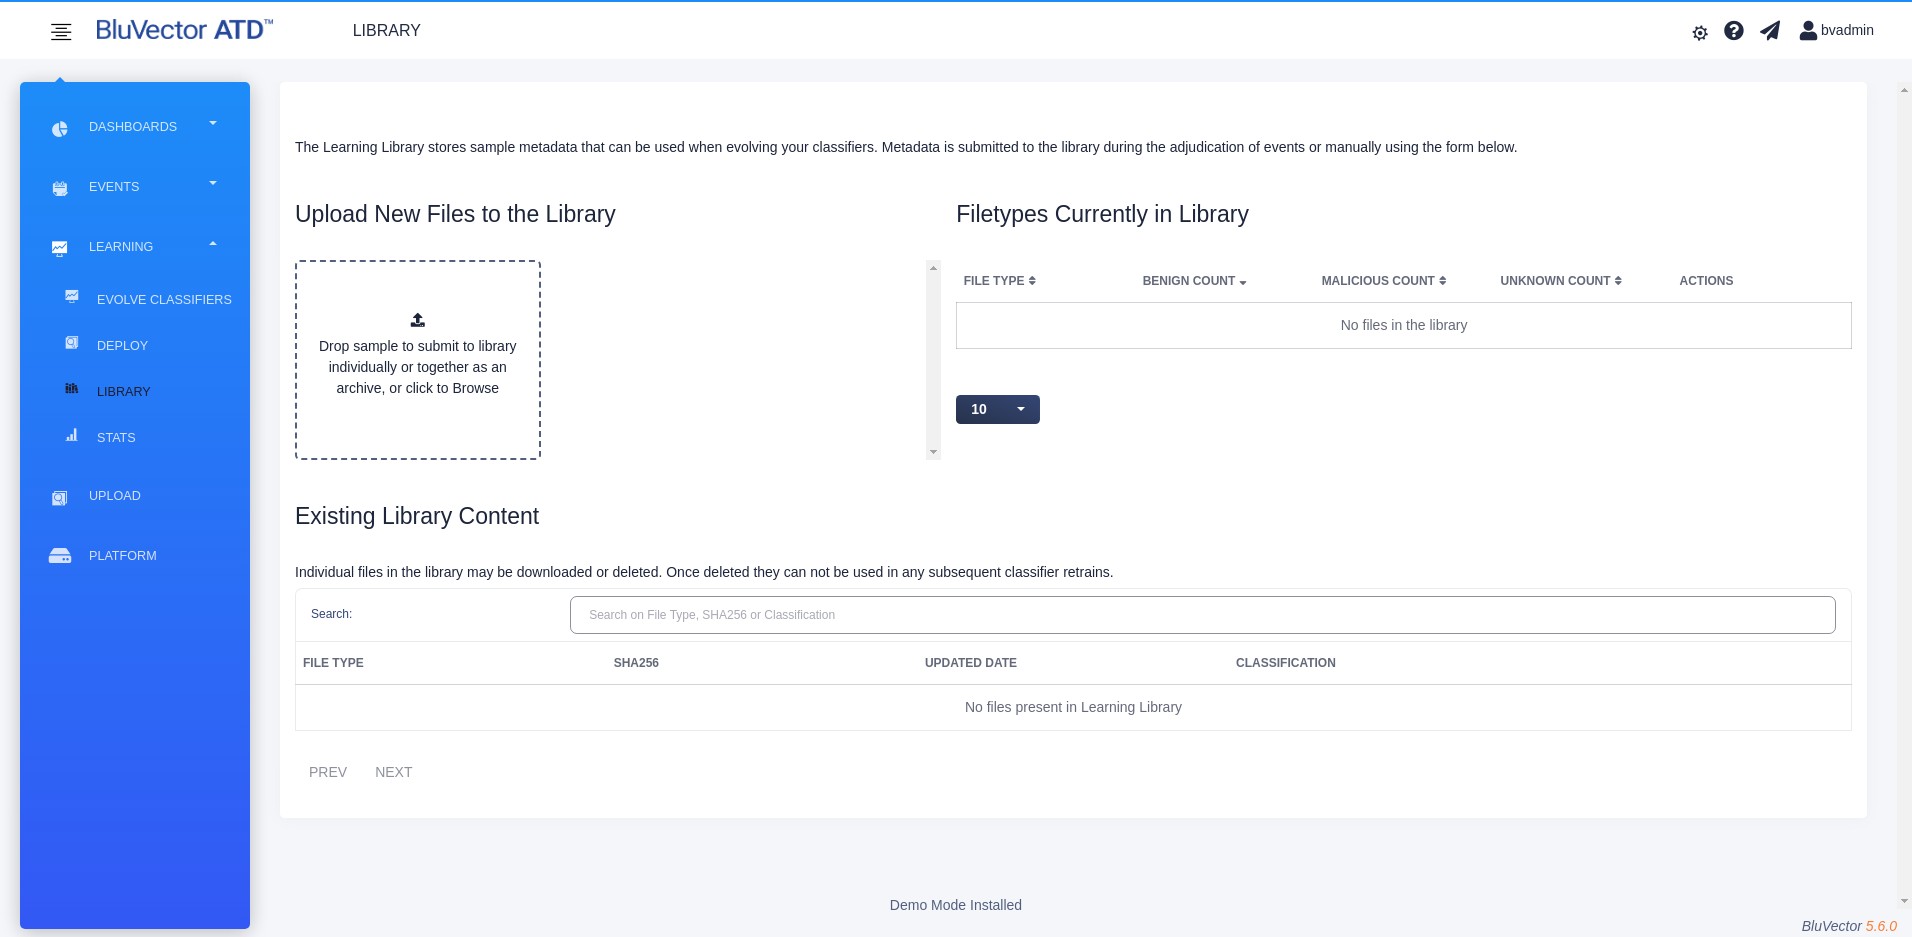
Fig. 41: Learning Library Screen
You can drag a file to the upload area, or you can click in the upload area to browse for the file you want to upload, select the file, and then select Open.
The files being uploaded will appear in a list. Select the classification for each file.
Select Upload Sample(s).
Procedure: Manage or Delete a Filetype in the Library
Warning:
Deleting a filetype will remove all files of that type, including both manually uploaded and automatically collected ones.
Follow these steps to manage or delete a filetype in the Machine Learning Engine Library:
Select LEARNING from the menu on the left side of the screen.
Select LIBRARY from the submenu that appears. The “Learning Library” Screen appears (see Figure: Learning Library Screen).
To remove all benign or malicious filetypes from a particular classifier:
Locate the filetype in the Filetypes Currently in Library section that you wish to manage.
To remove all benign files for that filetype, select Remove Benign.
To remove all malicious files for that filetype, select Remove Malicious.
To manage individual files:
Locate the file in the Existing Library Content section. You can enter a filetype, SHA256, or classification in the search bar to filter the list.
You may download a file by selecting the download icon.
To remove a file from the library, select the trash can icon for that file. The file will immediately be removed.
Updating the Classifier Bundle after a Retrain
When you upgrade your BluVector System from an older version to a newer version, the system will typically install a new set of factory classifiers into the Machine Learning Engine. If you have any deployed classifiers and your system receives a new classifier bundle update, then the Machine Learning Engine will attempt to retrain the new factory classifiers with data provided from your previous, retrained classifiers. These retrains will kick off automatically without any user input once a new factory data bundle has been installed on the system. If your system is connected to the BluVector Portal, new data bundles will be downloaded automatically. If you are missing a factory data bundle or are not connected to the BluVector Portal, please contact BluVector Customer Support to obtain an update.
Managing Data Sourcing for Retrains
A retrain will include all eligible files, up to the factory-configured maximum number of local samples that are allowed for retraining. If more than the maximum number exists for a particular filetype, the system will randomly select among all eligible files.
Rules cannot automatically adjudicate files for use in the on-premises learning process. In BluVector, rules set the event status. The learning process is based on file status.
To remove an individual file from the training list, you must change the file status. If you wish to mark a file as benign but do not wish to have it used for learning, set the file status to Info instead of Trusted. The on-premises learning process only uses files that are marked as Trusted or Malicious or that were manually uploaded to the Library.
You can remove all files from the training list by conducting a retrain and then rejecting the retrained classifier.
Sharing Classifiers
When using centralized retraining with an ATD Central Manager, new classifiers that are accepted for use in production will automatically be distributed to all joined BluVector Sensors.
To share custom retrained classifiers with other BluVector Sensors not on your network, see Section: Sharing Machine Learning Engine Classifiers).
Viewing Machine Learning Engine Statistics
Hector is the Machine Learning Engine in BluVector that detects malware. You can view its performance against each type of file across protocols and date ranges on the “Hector Statistics” Screen. To bring up this screen:
Select LEARNING from the left-hand menu.
Select STATS in the submenu that appears.
Enter a date and time range and select from the other available options. The choices are described in more detail in the procedure below.
Select Run to generate the statistics. The “Hector Statistics” Screen appears (see Figure: Hector Statistics Screen). If it is taking a long time for the screen to load, you can select Cancel. You will be able to see the information that was downloaded before the run was stopped.
The “Hector Statistics” Screen displays the following performance information:
The files are sorted by each Machine Learning Engine model in the ‘FILETYPE’ column. The ‘TOTAL’ column shows the total files by filetype. The ‘UNIQUE’ column displays the number of unique (not duplicated) files, and the ‘UNIQUE %’ column shows the percentage of the total files that are unique.
You can view a histogram for each filetype in the ‘FILE CONFIDENCES HISTOGRAM’ column. This histogram shows how many files occurred in the different percentiles of the Machine Learning Engine confidence levels.
 Fig. 42: Hector Statistics Screen
The colors of the percentiles in the graph shift from blue to purple to red.
The blue percentiles are the confidence scores that fall below the threshold, which is the score that a file must have in order to be considered suspicious.
The purple percentile is the one that contains the threshold score.
The red percentiles are the confidence scores above the threshold, which means that files falling within these percentiles are flagged as suspicious.
The score that a file must have to be Suspicious is listed in the ‘THRESHOLD’ column for each filetype.
The ‘OVER THRESHOLD’ column lists how many files of the filetype scored higher than the threshold, causing them to be considered suspicious.
The value in the ‘HIT RATE’ column indicates the percentage of unique files that the Machine Learning Engine has scored as being suspicious.
Note:
These statistics reflect Machine Learning Engine confidence only and do not include determinations by other analyzers. For example, files with high Machine Learning Engine confidence will appear on this screen, even if they were marked as “trusted” by a rule or user.
The following procedures describe how to view Machine Learning Engine statistics, as well as how to download a CSV file of the statistics. Downloaded statistics are useful for archival purposes, as well as for information-sharing among analysts.
Procedure: View Machine Learning Engine Statistics
Follow these steps to view the histograms and other statistics about the files that were analyzed by the Machine Learning Engine in the BluVector Sensor:
Select LEARNING from the left-hand menu.
Select STATS in the submenu that appears.
Enter a start date and time (UTC) for the beginning of the range for which you would like to view statistics. To enter a date, click within the ‘From’ field to display a calendar, then select a day.
Enter an end date and time. To enter a date, click within the ‘To’ field to display a calendar, then select a day.
You can choose to filter the files by different sources. Select the ‘Session’ field to see a menu of source options. For example, to view statistics about only those files that were uploaded through the ATD GUI, select GUI Upload. To view files from all sources, select All.
To choose whether to view all files or only unique files, select the ‘Histogram Criteria’ field to see a menu. Select Total to view statistics on all files, including duplicates. Select Unique to view statistics for one instance of each file.
Select Run to generate the statistics. The “Hector Statistics” Screen appears (see Figure: Hector Statistics Screen). If it is taking a long time for the screen to load, you can select Cancel. You will be able to see the information that was downloaded before the run was stopped.
Review the histograms and other statistics that appear, as described above.
To view the files associated with the statistics, select the link in the ‘FILETYPE’ column. For example, if you would like to view all PDFs from the statistics results, select the Adobe PDF documents link in the ‘FILETYPE’ column.
Procedure: Download CSV File of Machine Learning Engine Statistics
Follow the steps below to download a CSV of the Machine Learning Engine statistics. The exported CSV file does not include the histograms.
Follow the steps in the previous procedure to view the statistics on the screen. If the run was cancelled before finishing, you can still export the information that was generated before the run was stopped.
To export the results, select Export CSV above the results.
Uploading Files
You can upload files to the BluVector Sensor, including packet captures (PCAPs), in order to perform retrospective analysis. While the analysis results will contain generic event metadata with no protocol headers, the files will be analyzed in the same manner as if they had been ingested through the network interface.
Note:
The file that you upload cannot exceed 100 megabytes in size. This limitation also applies to any PCAP and the content encompassed within it. You cannot upload PCAP files to the BluVector Sensor if they exceed 100 megabytes, so the files contained in them must collectively be smaller than that.
The following procedure describes how to upload files through the ATD GUI.
Procedure: Upload a File
Follow these steps to upload a file to be analyzed:
Log in to the ATD GUI.
Expand the menu on the left side.
Select UPLOAD. The “Upload Files” Screen appears (see Figure: Upload Files Screen).
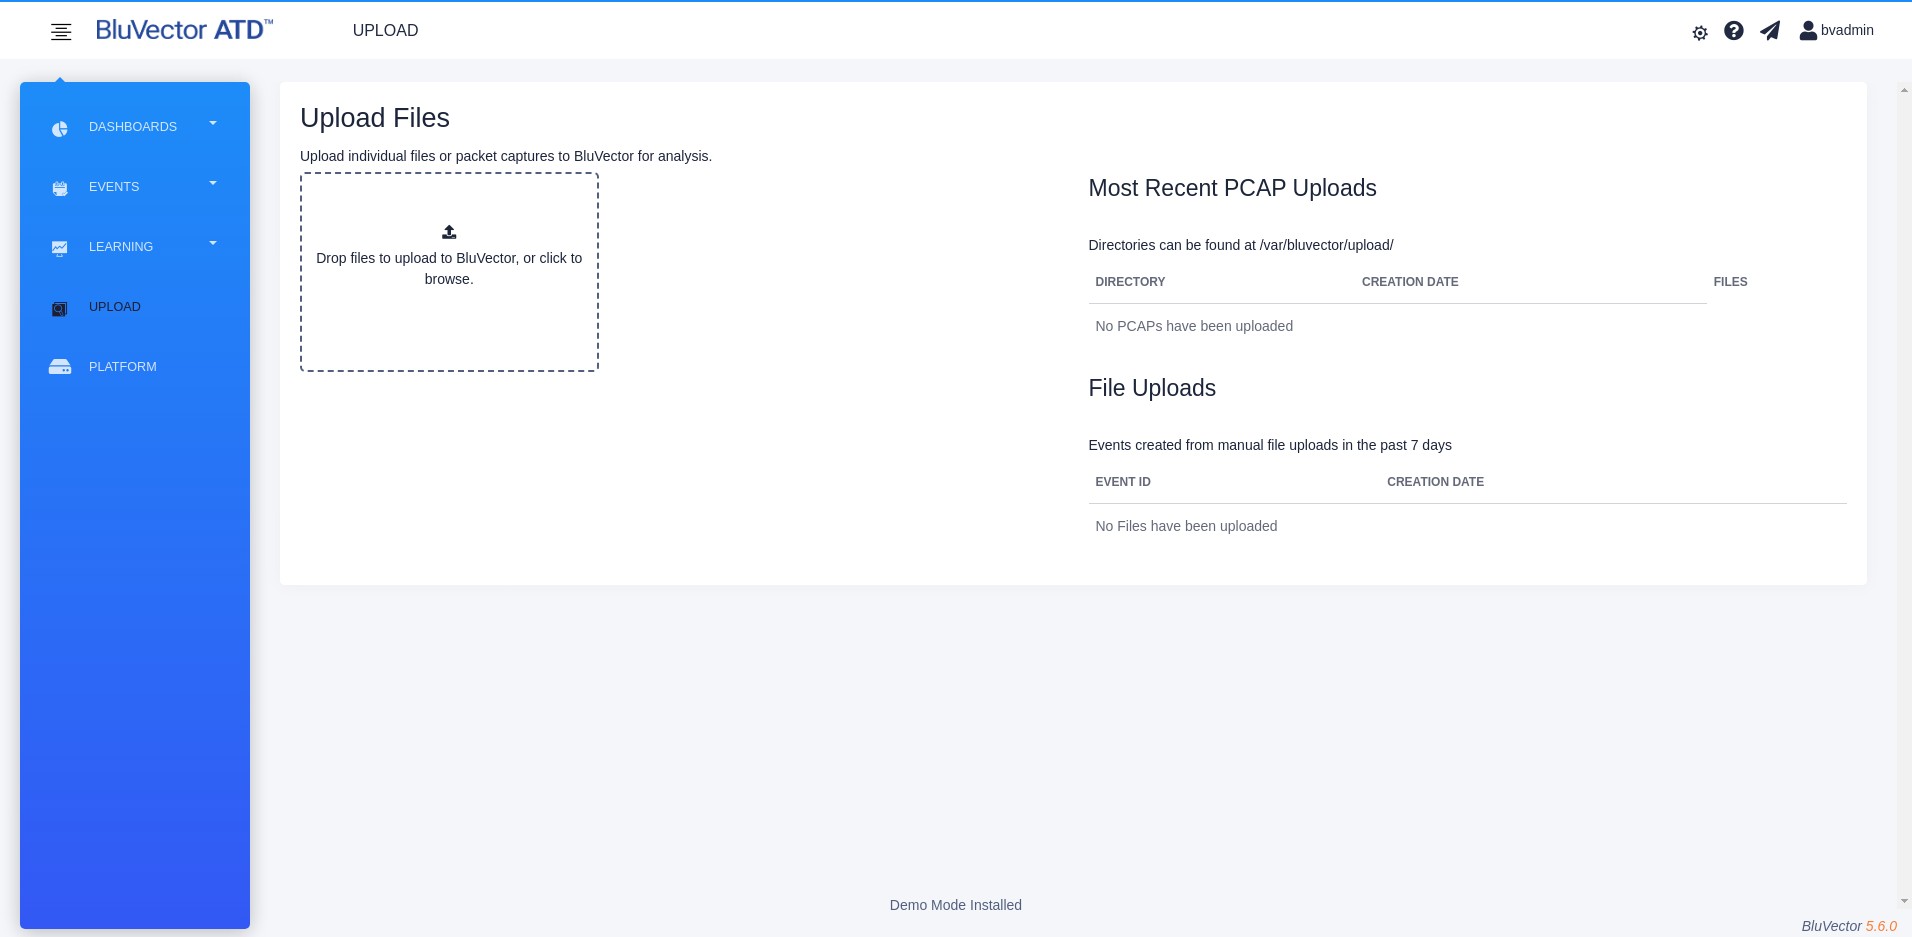
Fig. 43: Upload Files Screen
You can drag files to the upload area, or you can click in the upload area to browse for the file you want to upload, select the file, and then select Open.
Select Upload File.
When the file has been uploaded, a green banner will appear at the top of the screen indicating success (see Figure: Successful File Upload Banner).
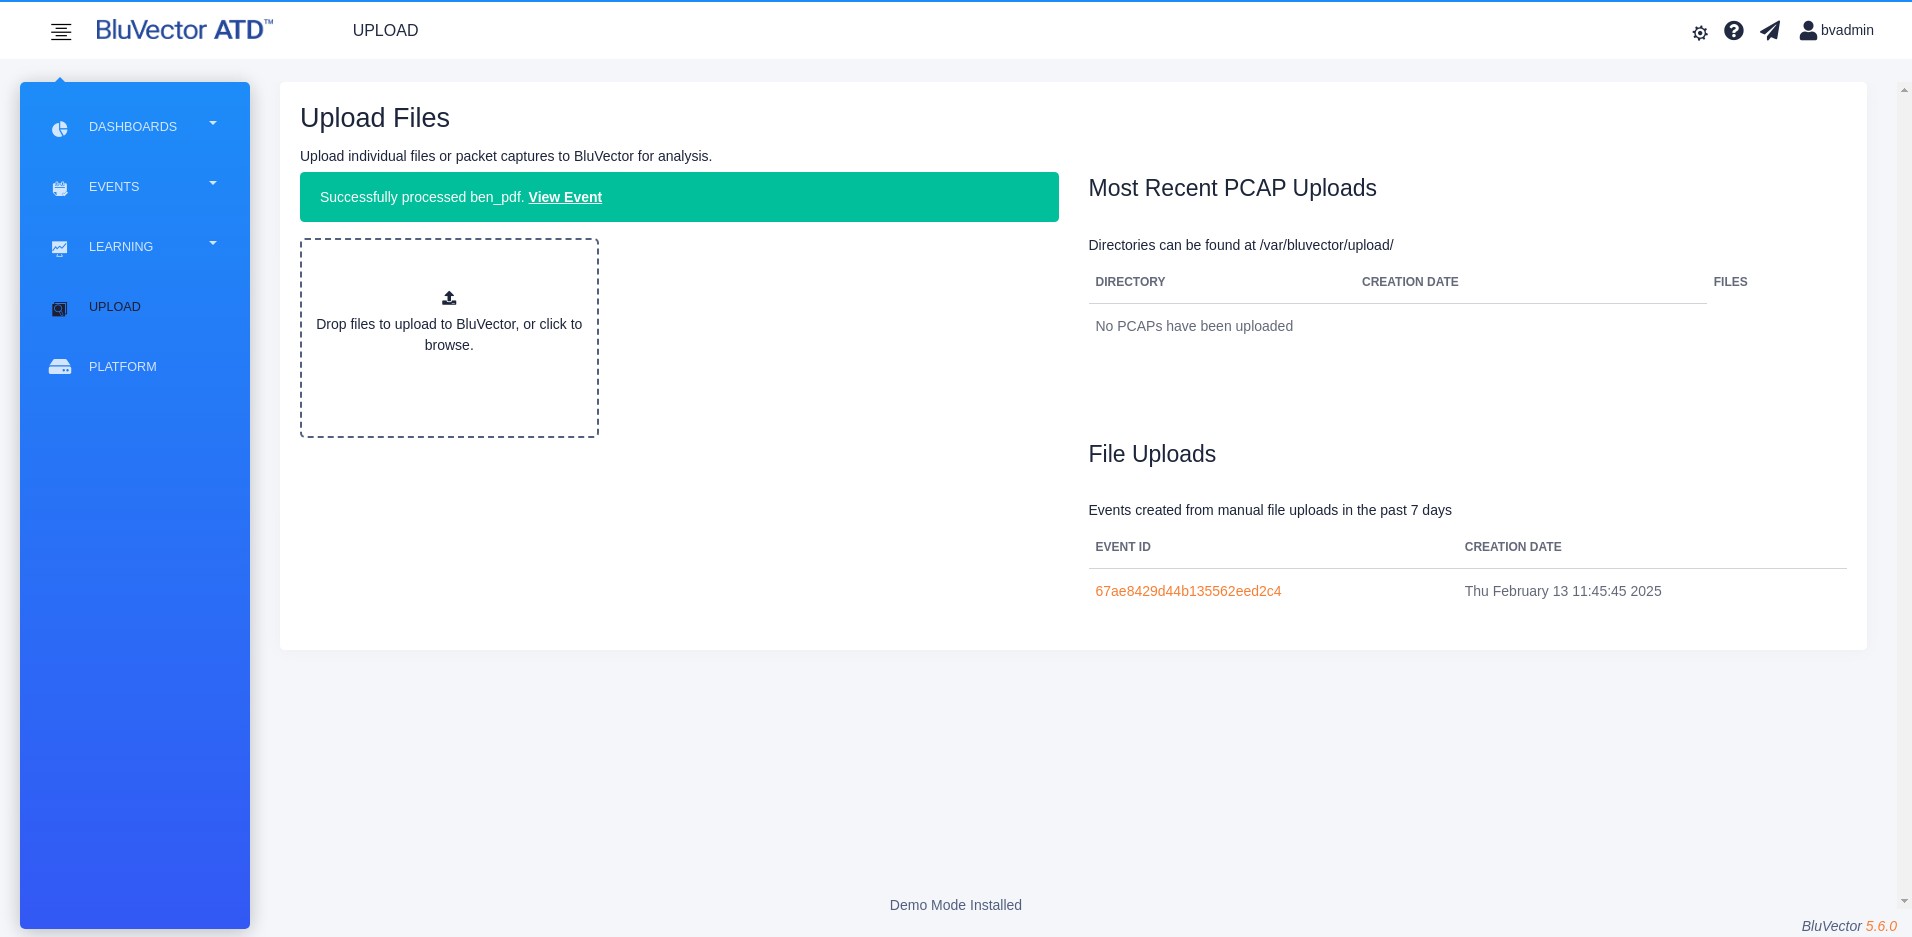
Fig. 44: Successful File Upload Banner
The success banner will include a link to an event containing the complete file analysis. Uploads of packet captures can generate several events. You can view those events in the Event Viewer. For more information about viewing events and files, see Section: Viewing Event Information. Also see Section: Searching Events with Queries for information about how to query for events in the Event Viewer.
Using Outputs
BluVector can transmit, or push, data from the appliance to another system over your network through outputs. There are many output types. They can send data such as:
BluVector event data (the most common data sent)
Health and status alerts
Extracted content
Some output types fit particular use cases better than others. Figure: Output Options shows use cases and which output types can be used to address each use case, along with recommendations. See Section: Configuring Outputs for information and procedures on configuring the available output types. Most output types support creation of one or more instances with different configuration values.
 Fig. 45: Output Options
Outputs use different protocols to transmit BluVector data.
The most generic outputs use TCP or UDP sockets to move data. The syslog protocol can be used over such outputs and is often the best generic option for sending event data.
In larger environments, a message broker (such as 0MQ or Kafka) is recommended. This will help to ensure delivery of BluVector event messages, even during periods of unstable network connectivity.
An output routing criteria, or query term, filters events for each configured output. An event must match the output routing criteria in order to be sent using that output.
Outputs also must convert BluVector event data as represented in the event and file schema (see Section: Understanding Event Schema on event schema). A key map translates internal data representation from BluVector into a flat representation, where each outgoing message relates to only a single event-file pair. Key maps are also useful for translating basic data schema. You can automatically rename BluVector data fields (keys) to something more convenient for the receiving system. For example, if you are sending events to a SIEM, and the SIEM understands source IP as ‘ipSrc’, then you can translate ‘meta.src’ to ‘ipSrc’ in the key map associated to the output. Not all outputs support key maps. Those that do not support key maps either send only the content of the event (that is, the associated files) or use the native BluVector schema.
You can add additional output options through the installation of custom Docker containers, such as the Splunk Forwarder container or a Logstash container. These containers often include log forwarding processes that take logs on disk and send them to external systems. This approach is one of the recommended methods for exporting Zeek log data from the system.
Note:
Docker container-based outputs should not be used to send BluVector event data.
If you need assistance with installing or configuring a container-based output, please contact Customer Support (see Section: Contacting Customer Support).
Using the Command-line Interface (CLI)
You can access the BluVector command-line interface (CLI) by using either a secure shell (SSH) or the web shell/terminal provided by the BluVector ATD Host. When logging into the system by either SSH or BluVector ATD Host, use a System Administrator account to access all of the available CLI features.
In addition to the provided CLI commands, you can access the REST API (see Section: Using the REST API) from the platform as you would from a remote system. You can find dynamic online documentation for the REST API at https://<bv_hostname>/api.
See the following for more information about using the CLI:
Section: Understanding CLI Functions in the BluVector ATD Host
Section: Understanding CLI Functions in BluVector Sensor or Ingest Containers
Understanding CLI Functions in the BluVector ATD Host
The BluVector ATD Host uses systemd for its initialization system, which provides a central log (“journal”) that you can inspect. The following table shows some useful CLI functions with the BluVector ATD Host.
Function Name | Description |
|---|---|
| Follow the system journal. |
| Follow the journal of a specific system. |
| Systemd control program. This is used to start BluVector provided images (if they are not started already). For example,
will start the integrations container. Systemctl uses “unit” files which control the starting of services. Within BluVector ATD Host, each docker image that makes up the system are services. The unit file controls what command is run to start the service, any dependencies on other services, and so on. |
| Exports the docker image referenced by the image tag to the specified file. |
| Imports into the docker environment the image saved with docker save. The image will be tagged with the same name as the image that was saved. |
| This creates a new tag associated with the image. This is commonly used to have different versions of an image and to tag one of those as “latest”. By doing this, one can revert to previous images if there is a problem. For example, if one has an image
|
| Runs <command> in <container name>. If <command> is |
| Runs a file or pcap through Zeek, Suricata, SFA and associated analyzers, as appropriate. |
| Open a bash shell in the sensor container. |
| Open a bash shell in the ingest container. |
BluVector provides the following services at the BluVector ATD Host layer:
sensor.service
ingest.service
bv-gui.service
bv-licensing.service
telegraf.service
influxdb.service
redis.service
Understanding Docker Containers in BluVector
The BluVector application layer software runs in a series of Docker Containers. Depending on the type of BluVector appliance and the configuration of the appliance, some containers may not be available.
Container Name | Description |
|---|---|
bvcontainer/sensor | Primary container for the BluVector System. It contains the Scalable File Analysis (SFA) framework, backend REST API, and all of the content analyzers. |
bvcontainer/ingest | Contains the protocol analysis engines (Zeek and Suricata) and handles interaction with the monitoring port. |
bluvector/bv-intel | Contains the intel service. |
bluvector/bv-gui | Contains the front-end component of the ATD GUI. |
integrations/integrations | Contains a variety of custom integrations with third-party applications, including endpoints and firewalls. It also contains the auto adjudication and email notification components. |
telegraf/bah | Telegraf is a component of the BluVector metrics, health and status monitoring system. It is part of the TICK stack and is responsible for agent collecting and reporting. |
docker.io/influxdb | Influxdb is a time-series database used by BluVector metrics, health and status monitoring system. |
redis/bah | Redis is an in-memory data store and cache used by several components within the BluVector System. |
You may load and manage your own custom containers, in addition to those that compose the BluVector System. Any custom containers on the system will be preserved during system software updates. Containers mount shared volumes from the BluVector ATD Host and also have network connectivity to one another. CLI functions differ greatly for each container.
When logged into BluVector ATD Host, the list of available containers can be found by selecting the Containers link on the left-hand side navigation menu. From an SSH prompt, you can also use the command sudo docker images to list all images, or sudo docker ps to list all running images.
Understanding CLI Functions in BluVector Sensor or Ingest Containers
To access CLI functions within a container, you need to first bring up a command prompt within the container of interest by using the command: sudo docker exec -it <container_name> /bin/bash. Some useful CLI functions with the primary bvcontainer/sensor are:
Function Name | Description |
|---|---|
bv-cfg | Provides a shell interface to the BluVector configuration system. A help command is available throughout the shell. |
sfa-cli | Provides commands to the Scalable File Analysis framework, including the ability to clear event databases. Use the |
supervisorctl | Provides control over many of the key processes with the system, including start/stop/restart functions. Run the command without any arguments to see a list of services that can be manipulated. |
bvcm | Forces the execution of configuration Ansible playbooks. Use the |
zeekctl | Provides control options for Zeek. Use the |
suricata | Provides control options for Suricata. Use the |
mongo | Provides a shell interface to the MongoDB that stores all event metadata in BluVector. |
sfa-inject | Deprecated in favor of bv-inject. Runs a file through the SFA and associated analyzers (available only in the BluVector Sensor container). |
When working within the terminal, it is useful to know where key data can be found. See the following table for more information.
Directory | Description |
|---|---|
| Service and “full take” Zeek logs |
| Raw targeted logs organized by date and eventID |
| File content store organized by file sha256, with the path being |
Understanding Common Tasks Performed from the CLI
Many common CLI tasks must be performed within the container that is running the affected process. In some cases, you perform the task directly on the BluVector ATD Host. The following instructions indicate which container should first be accessed once you log into the BluVector. You can access command prompts within a container by using the docker exec command.
Adding a Custom Snort/Suricata Rule in the BluVector Sensor Container
You can manage the ET PRO ruleset provided as part of the BluVector subscription by one of these methods:
From the configuration screen (see Section: Configuring the Suricata Collection Engine)
Using the command-line interface
The command-line instructions are:
From a remote system:
scp <path_to_your_suricata_rules>.rules <admin_user>@<bv_hostname>:/home/<admin_
𝜔→user>
SSH into the BluVector and run
sudo docker cp /home/<admin_user>/<your_suricata_rules>.rules <sensor>:/opt/
𝜔→bluvector/repo/rules
sudo docker exec -it <sensor> /bin/bash
cd /opt/bluvector/repo/rules
chown artifact_storage:artifact_storage <your_suricata_rules>.rules
git add <your_suricata_rules>.rules
git commit -m “Added my custom rules.”
Understanding Assisted Suricata Tuning
Suricata rules can generate a large volume of alerts. If the rules are generating a lot of hits over several days, the behavior should be considered typical for your enterprise and therefore not worth continuously bringing them to the attention of security analysts. BluVector ATD provides an assisted Suricata tuning feature which allows you to get recommendations on which Suricata rules and/or (Signature, Source IP) pairs to suppress or disable in order to reduce noise.
The assisted tuning performs an analysis over a user-defined tuning window to formulate its recommendations. The goal is to reduce Suricata noise in the system by removing either entire rules or (Signature, Source IP) pairs that cause a lot of events. The recommendation technique allows you to set some parameters (see Section: Configuring the Suricata Collection Engine). The combined set of parameters determines how conservative or aggressive the tuning will be:
A more conservative approach will perform less noise reduction, but it preserves more possibilities for future detection.
An aggressive approach favors greater noise reduction at the expense of reducing future sensitivity to certain behaviors.
Conservative settings will try to preserve general use of a rule by attempting to find (Signature, Source IP) pairs that account for the majority of the noise being generated by the rule. This is not always possible, and in those cases, the system may recommend disabling one or more rules completely. Completely disabling a rule means that the rule will not alert, no matter what the source IP address may be.
The tuning feature will provide you with recommendations. It displays a list of actions to take, but you have full control over whether to accept or reject each individual recommendation. You may also choose to do some investigation prior to accepting some recommendations, to confirm that the activity is allowable for your network. Suricata often highlights activities that are not necessarily malicious, but they may violate IT or Security policies. These situations should still be remediated to maintain good cybersecurity practices.
Installing a Custom Docker Container from the BluVector ATD Host Terminal
You can run arbitrary code in an environment of your choice, while leveraging the BluVector file system through mounted volumes, by installing a custom Docker container. These instructions assume that a Docker Container image <my_docker_image>.tar has been created. Be sure to create the image external to BluVector.
From a remote system:
scp <path_to_docker_image>.tar <admin_user>@<bv_hostname>:/home/<admin_user>
SSH into the BluVector and run
sudo docker load -i <my_docker_image>.tar
sudo docker tag <my_docker_image_name> <my_docker_image_name>:latest
Create and install your system unit file to run the docker container.
systemctl start <my_docker_image_name>.service
Installing a Custom Systemd Unit (Service) from the BluVector ATD Host Terminal
You must place the systemd unit in the user’s home directory, due to limitations on administrative users’ permissions. Once the administrator has created a systemd unit, you can accomplish installation into systemd by the following:
In the administrator's home directory:
systemctl enable <absolute path to systemd-unit.service>
In the event the user would like to disable the service:
systemctl disable <systemd-unit.service>
Opening a New Firewall Port on the BluVector ATD Host
The BluVector ATD Host runs a host-based firewall that blocks all unused ports. If you are installing new software that requires a port to be exposed to the outside, you must add the new port to the allowed external ports list and restart the docker services.
In /etc/sysconfig/bah-docker:
Modify EXTERNAL_DOCKER_PORTS to include the new port
systemctl restart bah-docker-setup.service && systemctl restart docker.service
See the following sections for more information:
Section: Configuring SNMP Traps
Section: Configuring snmptrapd
Performing Cockpit Functions using CLI Commands
The functionality of the Cockpit interface can also be accomplished through command-line interface (CLI) commands.
Note:
On the BluVector ATD Host, be sure to log in as the bvadmin user or other administrator account to perform these commands. All Docker commands on the BluVector ATD Host level will be run as sudo.
The following sections provide more details and examples:
Section: 3. Executing Bundles using CLI
Section: 7. Joining and Unjoining a Sensor/Collector to a Central Manager using CLI
Section: 9. Enabling and Disabling SmartCard Authorization using CLI
1. Joining and Leaving a Domain using CLI
Using realm :
realm discover -v [realm-name]
Discover available realm
realm join -v [-U user] realm-name
Enroll this machine in a realm
realm leave -v [-U user] [realm-name]
Unenroll this machine from a realm
realm list
List known realms
realm permit [-ax] [-R realm] user ...
Permit user logins
realm deny --all [-R realm]
Deny user logins
Examples
# Login as bvadmin user.
$ realm discover -v TEST.BLUVECTOR.IO
[bvadmin@localhost ~]$ realm discover -v test.bluvector.io
* Resolving: _ldap._tcp.test.bluvector.io
* Performing LDAP DSE lookup on: 10.0.x.x
* Successfully discovered: test.bluvector.io
test.bluvector.io
type: kerberos
realm-name: TEST.BLUVECTOR.IO
domain-name: test.bluvector.io
configured: kerberos-member
server-software: active-directory
client-software: sssd
required-package: oddjob
required-package: oddjob-mkhomedir
required-package: sssd
required-package: adcli
required-package: samba-common-tools
login-formats: %U@test.bluvector.io
login-policy: allow-realm-logins
1.a. Join AD domain
/usr/sbin/realm -v join --user=<user>@<domain> --computer-ou=<OU>,DC=<DC>
1.b. Leave AD domain
[bvadmin@localhost ~]$ /usr/sbin/realm -v leave
2. Setting and Clearing Proxies using CLI
# Set proxies in bv-cfg
sudo docker exec -i sensor bash -c \
'set-bv-proxies <JSON String for system.network.proxies>'
# List current proxy settings
sudo docker exec -i sensor bash -c \
'/usr/bin/set-bv-proxies list'
# Clear proxies in bv-cfg
[bvadmin@localhost ~]$ sudo docker exec \
-i sensor bash -c '/usr/bin/set-bv-proxies clear'
Examples
[bvadmin@localhost ~]$ sudo docker exec -i sensor bash -c \
'set-bv-proxies "{
\"https_enabled\":\"true\",
\"https_port\": 3128,
\"https_host\":\"https://proxy01.bv.bluvector.io\"
}"'
Output : Proxies Updated
[bvadmin@localhost ~]$ sudo docker exec -i sensor bash -c \
'/usr/bin/set-bv-proxies clear'
Output : Proxies Cleared
3. Executing Bundles using CLI
# Executing a bundle
/usr/sbin/exec-bundle [source_file]
4. Managing Upgrades using CLI (ostree)
# These commands will be run on both CM and Sensor upgrades.
# Get current version and ostree name of ATD appliance
/usr/bin/rpm-ostree status -b
# Download latest ostree and RPM data, don't deploy
# Requires ostree/branch name information.
sudo rpm-ostree rebase --download-only <ostree_name>
# Rebase and install
sudo rpm-ostree rebase <ostree_name>
# Reboot the system
systemctl reboot
5. Configuring NTP using CLI (chrony)
# chronyc commands
sudo chronyc help
# To add a new server
sudo chronyc add server time.bv.bluvector.io
200 OK
# To enable the new server, run:
sudo chronyc online
200 OK
# To restart chronyd.service
systemctl restart chronyd.service
6. Configuring Networking using CLI (nmcli)
Usage: nmcli [OPTIONS] OBJECT { COMMAND | help }
OBJECT
g[eneral] NetworkManager's general status and operations
n[etworking] overall networking control
r[adio] NetworkManager radio switches
c[onnection] NetworkManager's connections
d[evice] devices managed by NetworkManager
a[gent] NetworkManager secret agent or polkit agent
m[onitor] monitor NetworkManager changes
Examples
# NetworkManager's general status and operations
sudo nmcli general hostname <new_hostname>
# Devices managed by NetworkManager
nmcli device status
# Overall networking control
sudo nmcli networking connectivity check
# NetworkManager's connections
nmcli connection show
nmcli con mod Wired\ connection\ 1 connection.id enp9s0f0
7. Joining and Unjoining a Sensor/Collector to a Central Manager using CLI
Note:
Join and unjoin commands will be run from the CM only.
7.a. Join Commands
# Join a collector host
/usr/bin/joinhosts.sh HOST[:USERNAME:PASSWORD]
# Force join a collector
joinhosts.sh -f HOST[:USERNAME:PASSWORD]
# Get the status of the join
/usr/bin/collector-status -cmj
7.b. Unjoin Commands
unjoinhosts.sh -h
# Batch unjoin collectors
/usr/bin/unjoinhosts.sh HOST1 HOST2
# Force unjoin a collector
unjoinhosts.sh -f HOST
# Get the status of the unjoin
/usr/bin/collector-status -cmj
# Verify collector is unjoined and removed from CM hosts file
cat /etc/bv-registrar/hosts
Examples
[bvadmin@localhost ~]$ /usr/bin/joinhosts.sh bv_atd.bah:bvadmin:bluvector
[bvadmin@localhost ~]$ /usr/bin/unjoinhosts.sh bv_atd.bah
[bvadmin@localhost ~]$ /usr/bin/collector-status -cmj
8. Configuring User Accounts using CLI
Local User Accounts
# Check permissions and groups
[bvadmin@localhost ~]$ cat /etc/passwd
[bvadmin@localhost ~]$ cat /etc/group
[bvadmin@localhost ~]$ id
uid=1000(bvadmin) gid=1000(bvadmin) groups=1000(bvadmin),10(wheel) \
context=unconfined_u:unconfined_r:unconfined_t:s0-s0:c0.c1023
9. Enabling and Disabling SmartCard Authorization using CLI
Enable SmartCard authorization
===============================
[bvadmin@smodak-410-s ~]$ sudo docker exec -i sensor bash -c \
'bv-cfg << EOF
set system.smartcard.smartcard_required True
set system.smartcard.ocsp_url 'http://crl.test.bluvector.io/ocsp'
set system.smartcard.crl_url 'http://crl.test.bluvector.io/crld'
set system.smartcard.crl_polling_interval 6.0
set system.smartcard.include_nonce False
set system.smartcard.ssh_keys_cleanup_interval 24.0
set system.management.privileged_groups ['wheel','ad_admin']
set system.management.regular_groups ['staff','ad_user']
stage
deploy
exit
EOF'
Disable SmartCard authorization
================================
[bvadmin@smodak-410-s ~]$ sudo docker exec -i sensor bash -c \
'bv-cfg << EOF
set system.smartcard.smartcard_required False
stage
deploy
exit
EOF'
Using the REST API
BluVector ATD provides a REST API for customers to programmatically interact with important BluVector features. The REST API is useful for integrating external software with BluVector data. The external software initiates requests using a user’s API token for authentication. That user account is then used to perform the action associated with the API endpoint request. The system sends a response in less than a few seconds.
This section covers how to find your REST API token, as well as how to view the API documentation.
Procedure: Find your REST API Token
Follow these steps to find your REST API token:
From the ATD GUI, select your user name in the upper right corner. A menu appears.
Select Account. The “Account Configuration” Screen appears.
Select Show Token. The token appears (see Figure: Account Configuration Screen Showing API Token). The token is displayed in the form of a 40 character hex string, similar to this example:
61dda8f77ed656a0637bf82961e7883cbd242cf7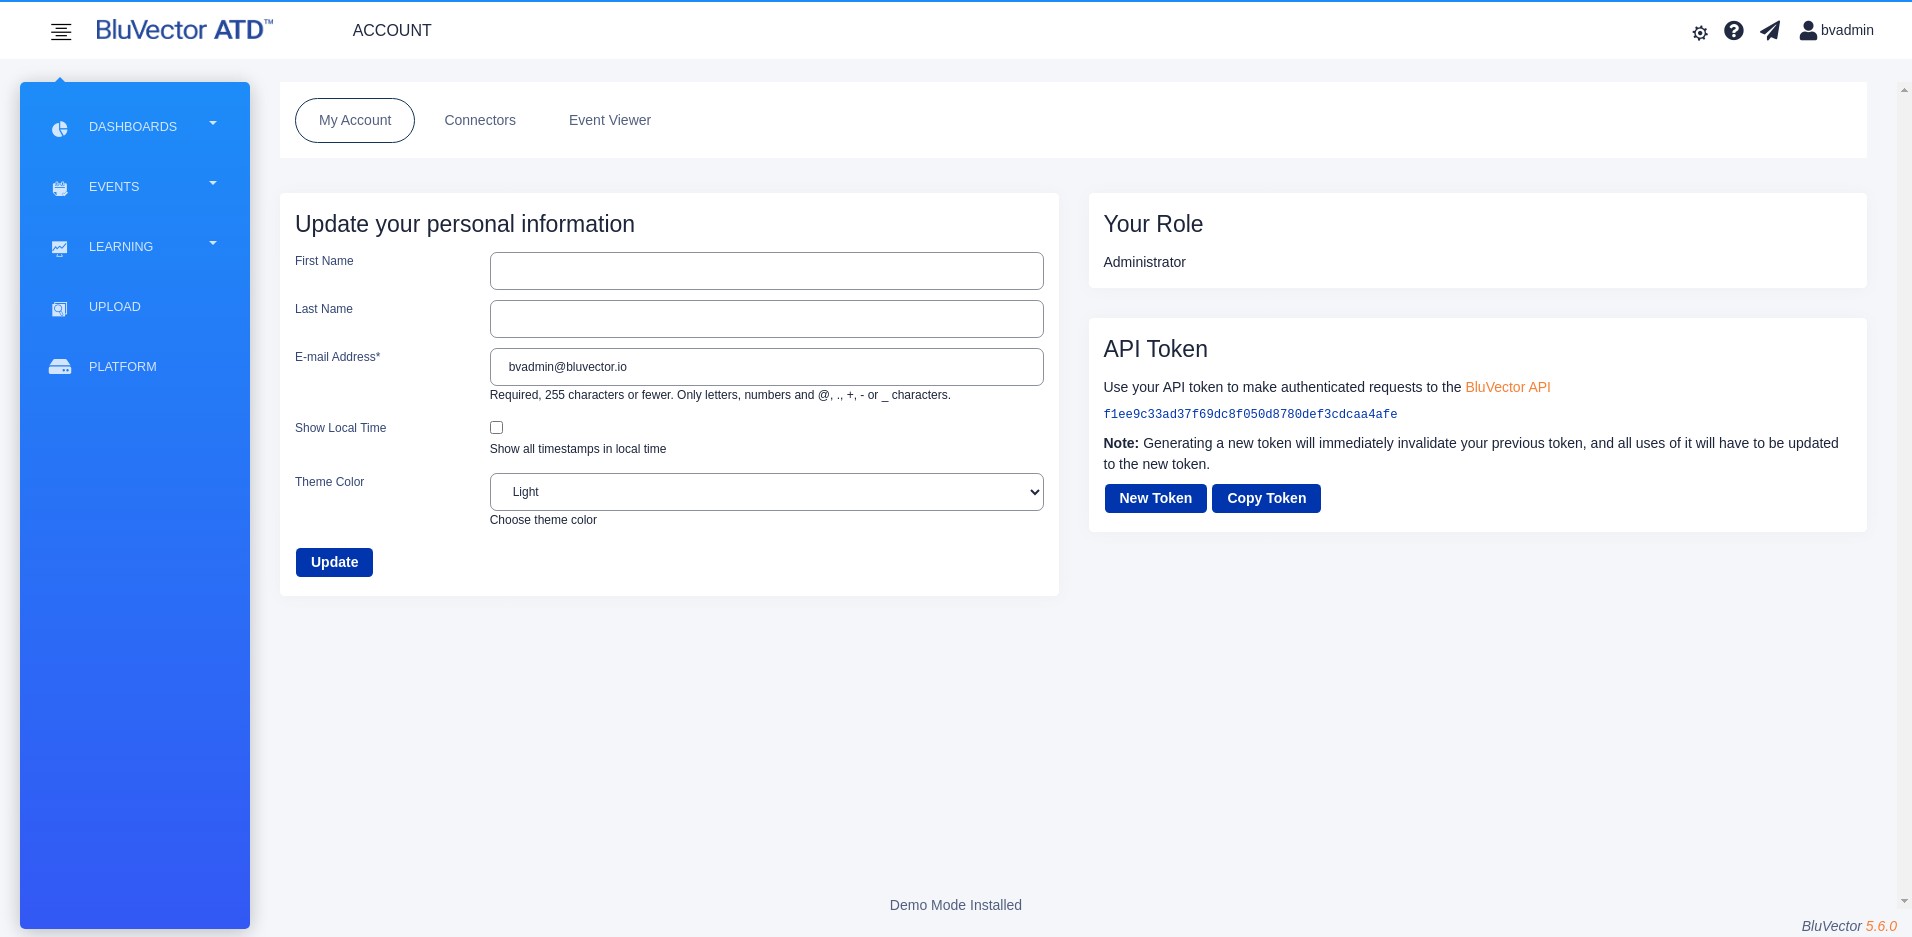
Fig. 46: Account Configuration Screen Showing API Token
You may copy the contents of the API Token to the clipboard by selecting Copy Token.
If you want to invalidate your existing token and generate a new one, select New Token.
Procedure: View the API Documentation
Follow these steps to view the API documentation:
Select the question mark icon located at the top of the screen. A menu appears with options for the types of documentation that are available.
Select API Documentation. The “API Documentation” Screen appears (see Figure: API Documentation Screen).
Fig. 47: API Documentation Screen
Configuring SNMP Traps
The BluVector Gen3 hardware consists of a Dell PowerEdge FX2s chassis and one or more Dell PowerEdge FC640 compute nodes. The BluVector Gen4 hardware consists of Dell PowerEdge R650 servers.
These components may be configured to send SNMP traps (alerts) to a remote host in response to hardware events. A hardware event could include a power supply failure or exceeding a temperature threshold. These alerts are hardware specific and do not include BluVector related events. More detailed information is available from the Dell Support website.
Dell PowerEdge FX2s: https://www.dell.com/support/home/us/en/19/product-support/product/ poweredge-fx2
Dell FC640: https://www.dell.com/support/home/us/en/04/product-support/product/poweredge-fc640
Dell R650: https://www.dell.com/support/home/en-us/product-support/product/poweredge-r650/overview
Configuring snmptrapd
The snmptrapd daemon will receive SNMP traps from the network and write them to a file. Installation of snmptrapd depends on the operating system. Refer to the OS vendor’s documentation for assistance. The messages sent include vendor specific information that can be translated into more useful information using Management Information Bases (MIBs). Download the latest version of the Dell OpenManage MIBs for PowerEdge from the Dell Support website to the host that will run snmptrapd.
Configuring the Dell PowerEdge FX2s Chassis
The following procedure will configure the Dell PowerEdge FX2s chassis to send alerts to the remote host configured above. More information on configuring the Dell PowerEdge FX2s chassis is available at the Dell Support website.
The procedure below describes how configure SNMP Alerts on the PowerEdge FX2s Chassis.
Procedure: Configure SNMP Alerts on the PowerEdge FX2s Chassis
Follow these steps to configure SNMP Alerts on the PowerEdge FX2s Chassis:
Open a web browser and navigate to
https://<fx2s_chassis>, where<fx2_chassis>is the hostname or IP address configured during initial configuration of the PowerEdge FX2s chassis.Log into the web interface.
Select Alerts.
Configure the alerts to be sent. By default, all alerts will be sent.
Select Traps Settings.
Enter the hostname or IP address of the remote host configured above into the ‘Destination’ field.
Select Apply to save the settings.
Select Send in the ‘Test Trap’ column to send a test alert.
Review the log file configured above to verify that the alert was received.
Configuring the Dell PowerEdge FC640
The following procedure will configure the Dell PowerEdge FC640 iDRAC to send alerts to the remote host configured above. More information on configuring the Dell PowerEdge FC640 iDRAC is available at the Dell Support website.
The procedure below describes how to configure SNMP Alerts on the PowerEdge FC640 iDRAC.
Procedure: Configure SNMP Alerts on the PowerEdge FC640 iDRAC
Follow these steps to configure SNMP Alerts on the PowerEdge FC640 iDRAC:
Open a web browser and navigate to
https://<fc640_idrac>, where<fc640_idrac>is the hostname or IP address configured during the initial configuration of the PowerEdge FC640 iDRAC.Log into the web interface.
Select Configuration and select System Settings from the menu that appears.
Select SNMP Traps Configuration to expand the section.
Enable the destination by selecting the checkbox in the ‘State’ column.
Enter the hostname or IP address of the remote host configured above into the ‘Destination Address’ field.
Select Apply to save the changes.
Select Send in the ‘Test SNMP Trap’ column to send a test alert.
Review the log file configured above to verify that the alert was received.
Updating License Files
Each BluVector Sensor must have a valid license file to operate. Each license file has an expiration date and is signed by the certificate authority for BluVector. If a BluVector Sensor has an expired license file:
The system will stop processing traffic.
No new events will be generated based on your network traffic.
The system will not be able to receive software updates.
To renew your license file, you must contact BluVector Customer Support.
You may view and upload your license file by following the procedures described in Section: Viewing and Uploading System License and CSR.
Certain system features and analysis engine updates delivered through the BluVector Portal are separately entitled. To get the list of entitled portal-enabled features and updates, you can run the following commands from the BluVector ATD Host command-line. You will need your BluVector Portal API key. Portal-enabled feature entitlement is enforced by the BluVector Portal on a per request basis.
If the system is behind a proxy:
export https_proxy=<proxy_url>:<proxy_port>
. /etc/sysconfig/bv-uuid
export API_KEY=<portal api key>
curl https://$API_KEY:$UUID_SIMPLE@api.bluvector.io/me/v1/; echo